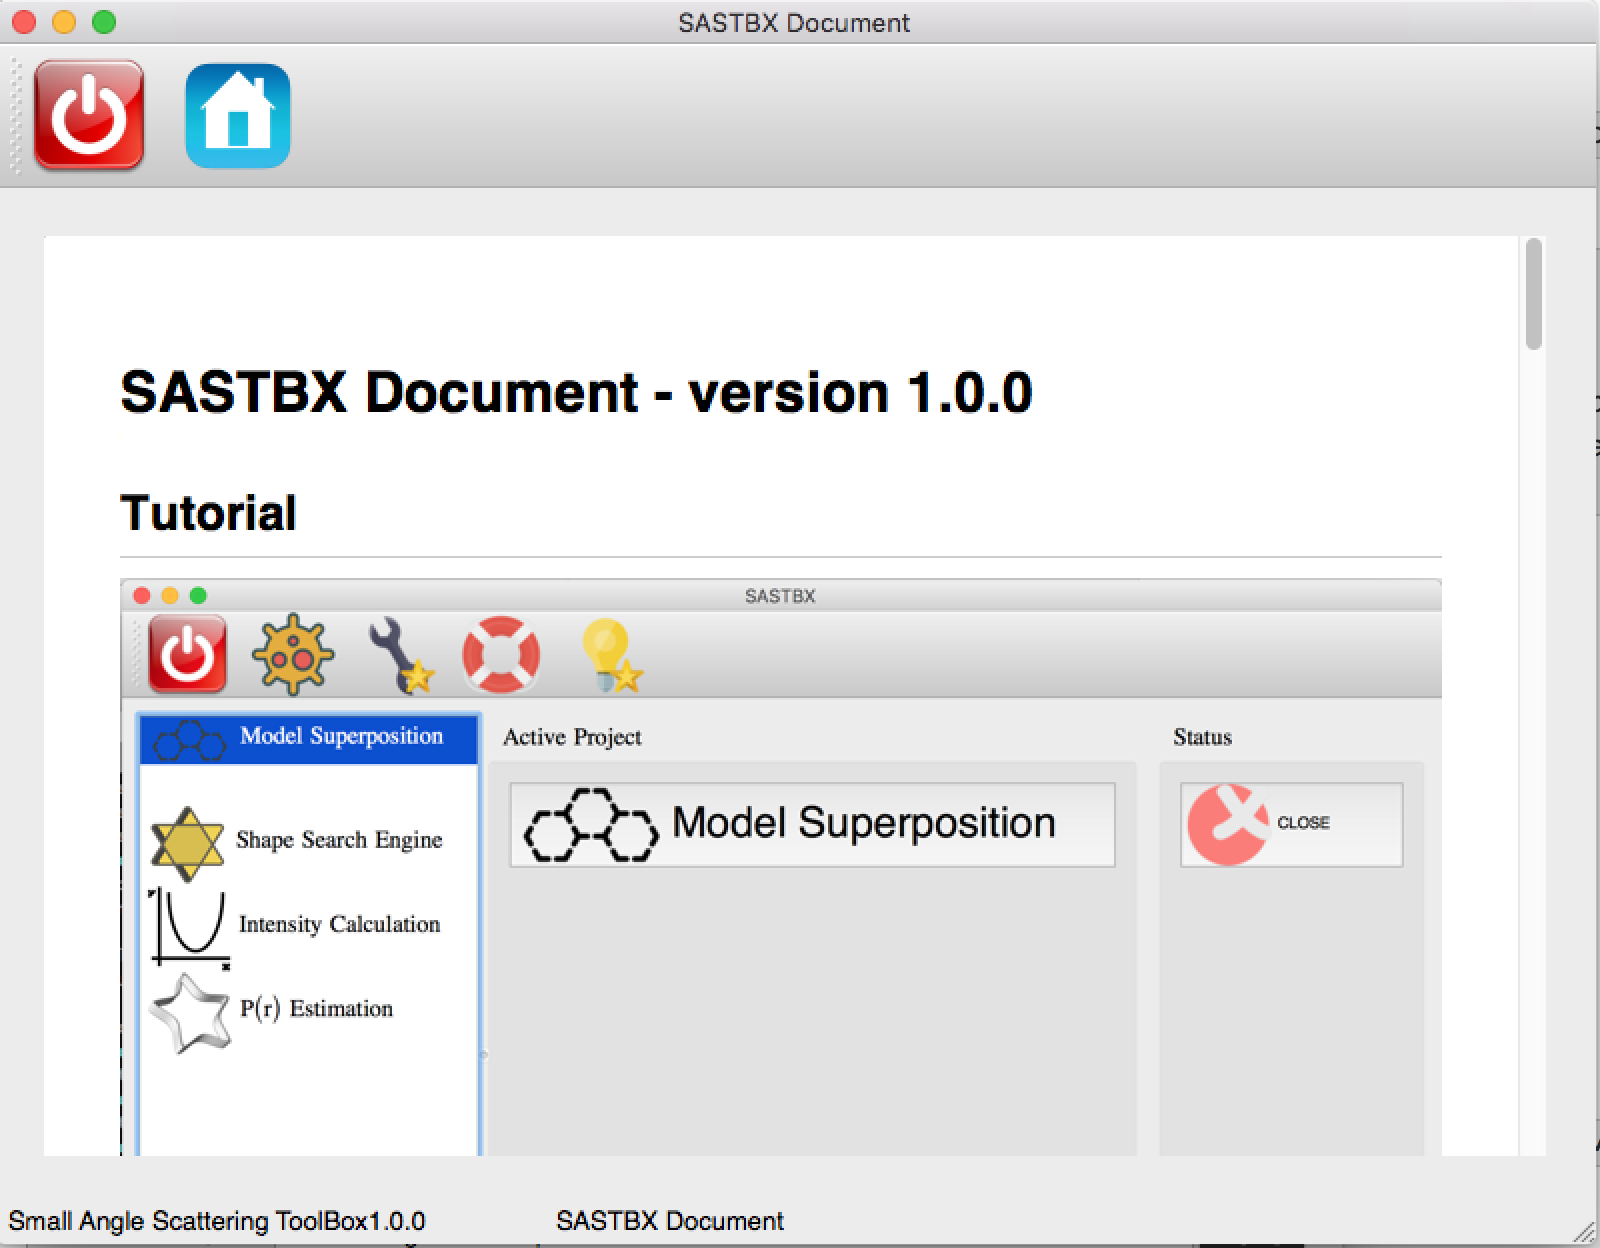
GUI Document
Download the GUI Version

Open the Application by double clicking the icons above.
Project Location
Set the project directory in the homepage:
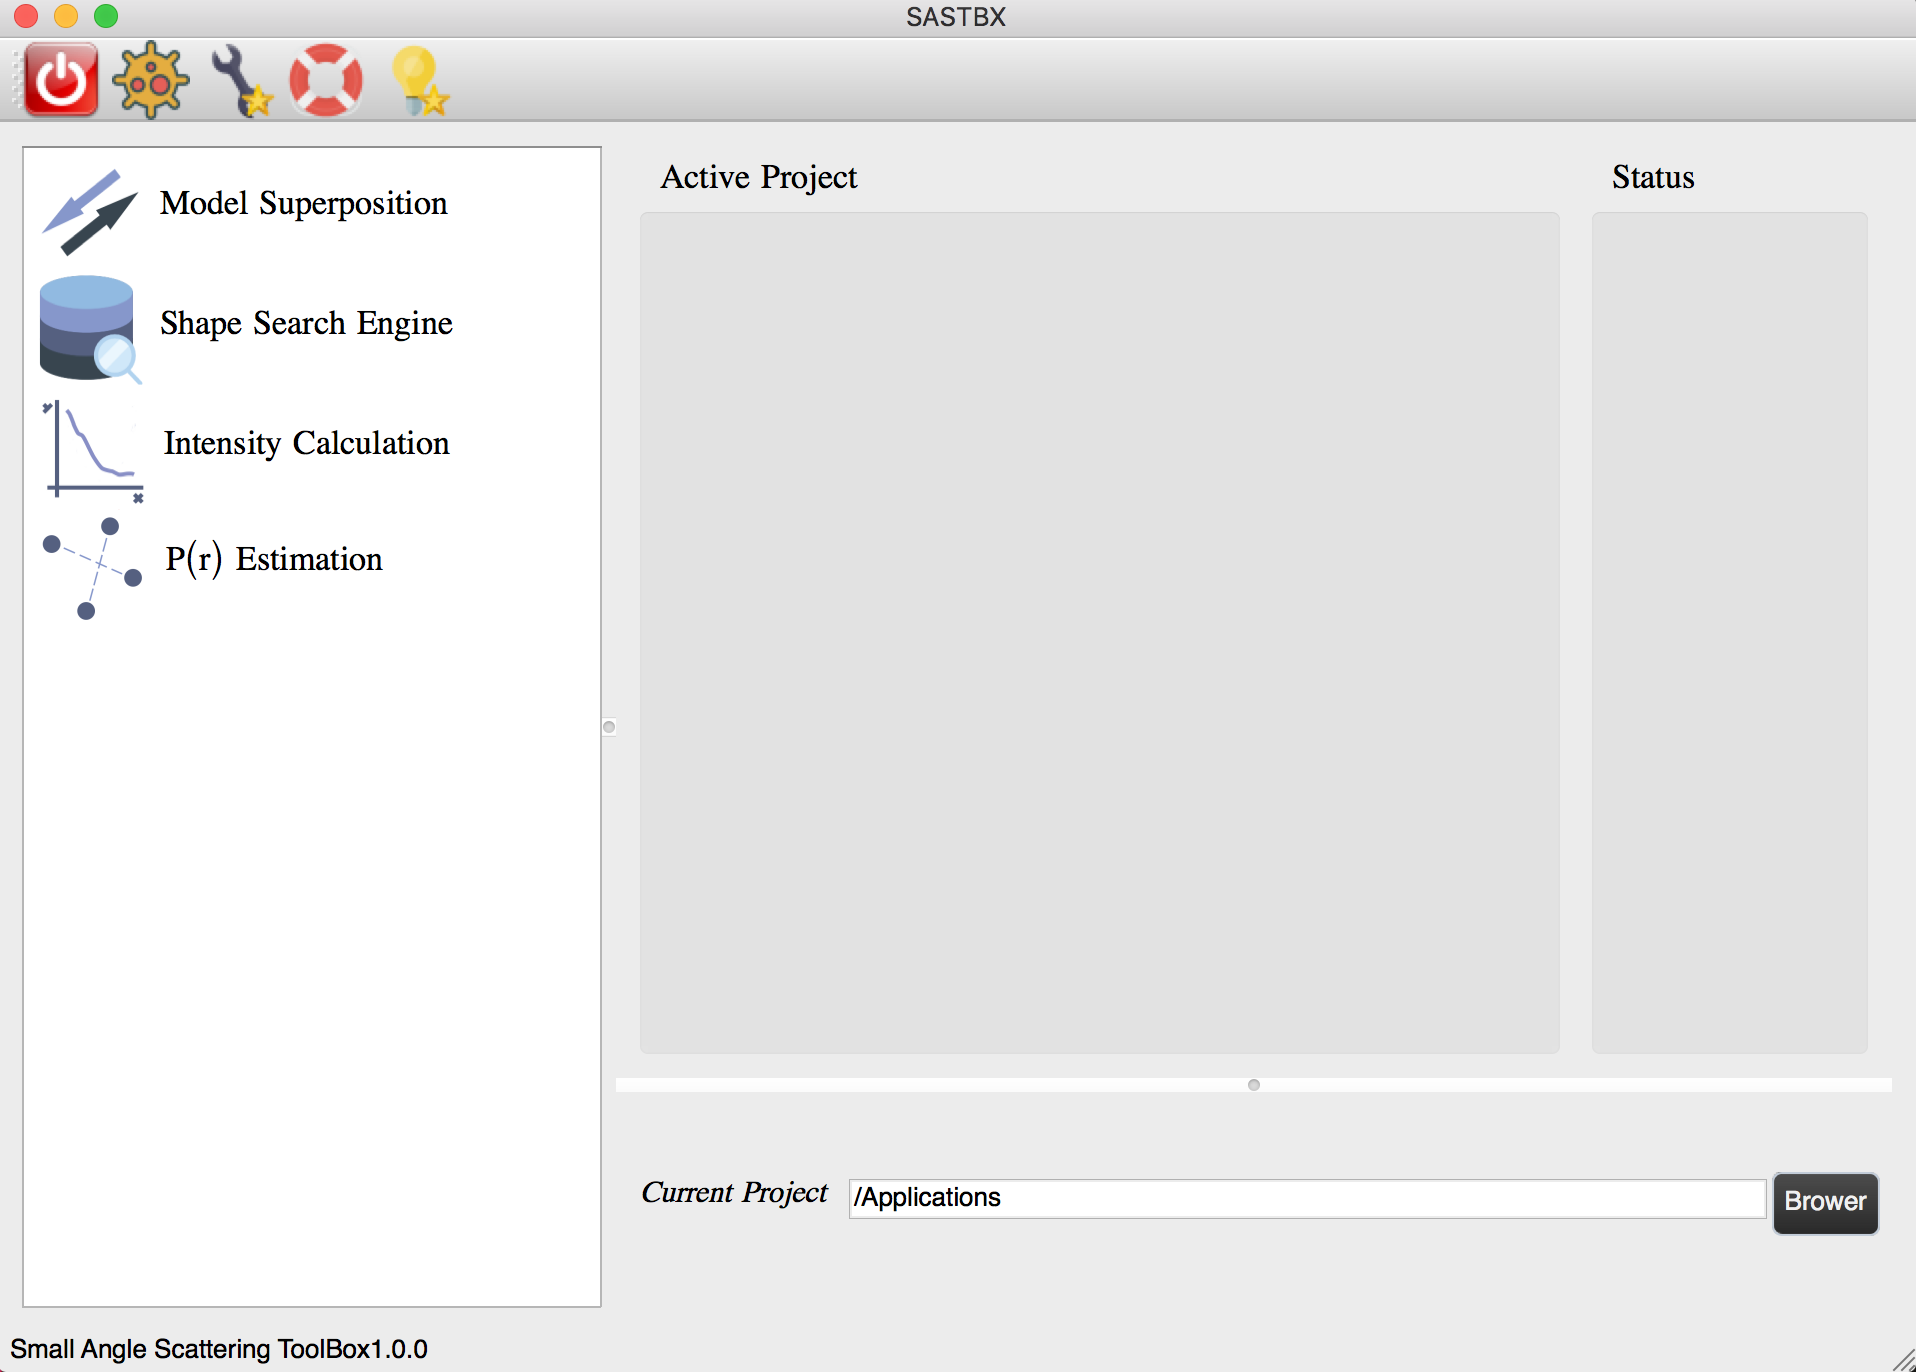
All the result will located in the directory you selected, and for each function, there will generate a subdirectory with the same name of the project.
Preference
For light GUi version Set SASTBX location, a directory contain module and build directory of SASTBX
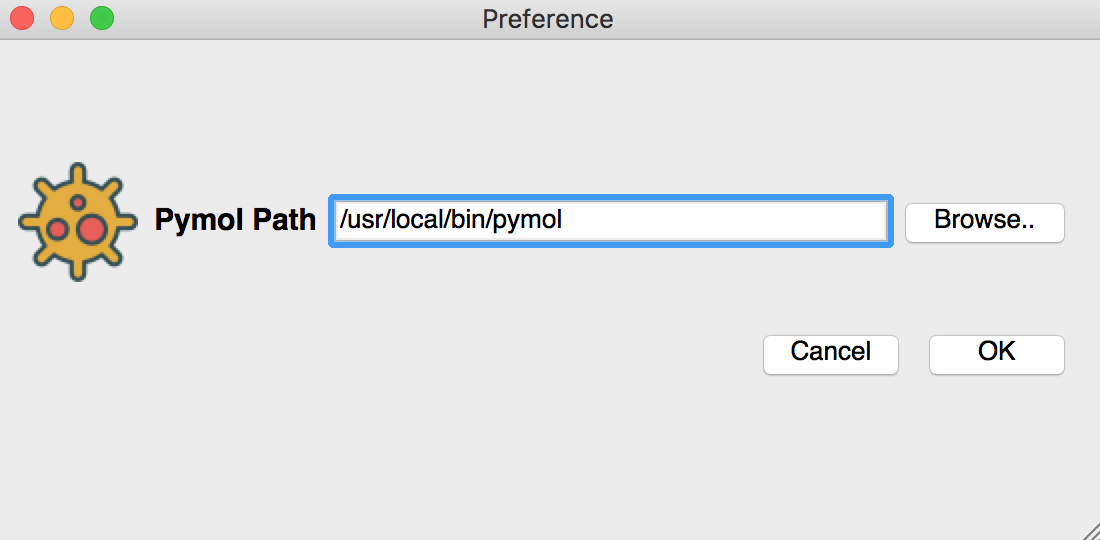
Set the pymol location in the preference page.
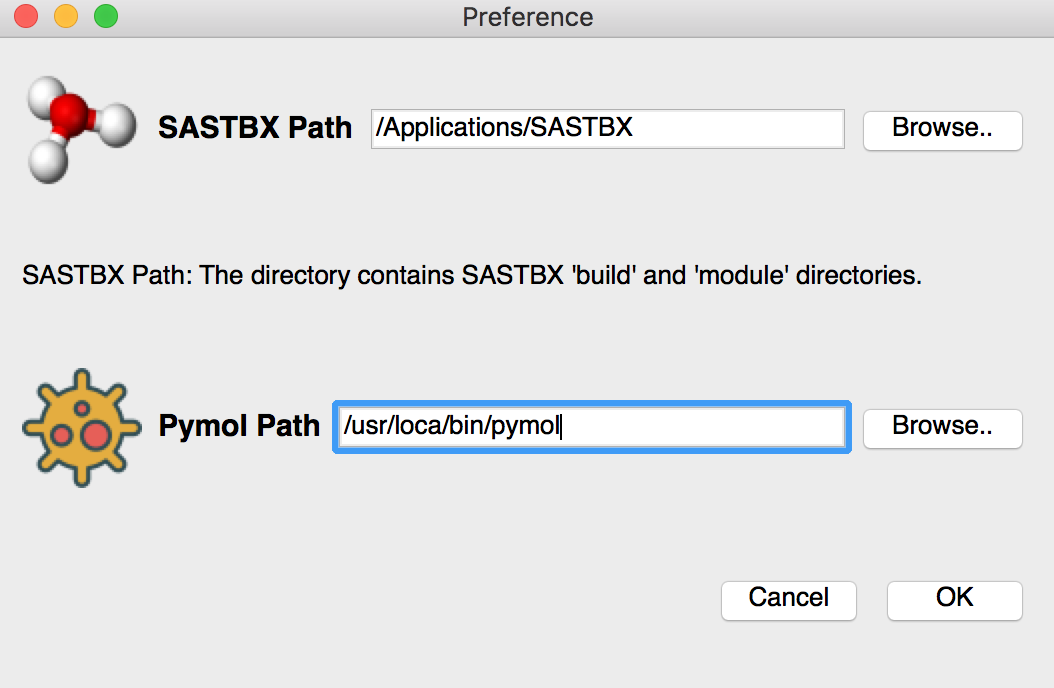
For complete GUI version Set the pymol location in the preference page.
Note:
- pymol path:
the path of MacPymol application or the pymol executable file.
- SASTBX path:
the directory which contains the source code directory named “modules” and compile directory named “build”.
Here are some examples of pymol path:
/Applications/MacPymol.app

/usr/bin/pymol
The example of SASTBX path:
/Applications/SASTBX/
Functions
After setting the project location and the preference, you can begin to use the funciton you need. The following part will introduce how to use these funcions in GUI version.
Model Superposition
Superpose models at low resolutions. The required inputs are 2 protein models or maps, all the other parameters are optional.

The the program will start with clicking ‘run’ button. And the log can be seen in the widget.
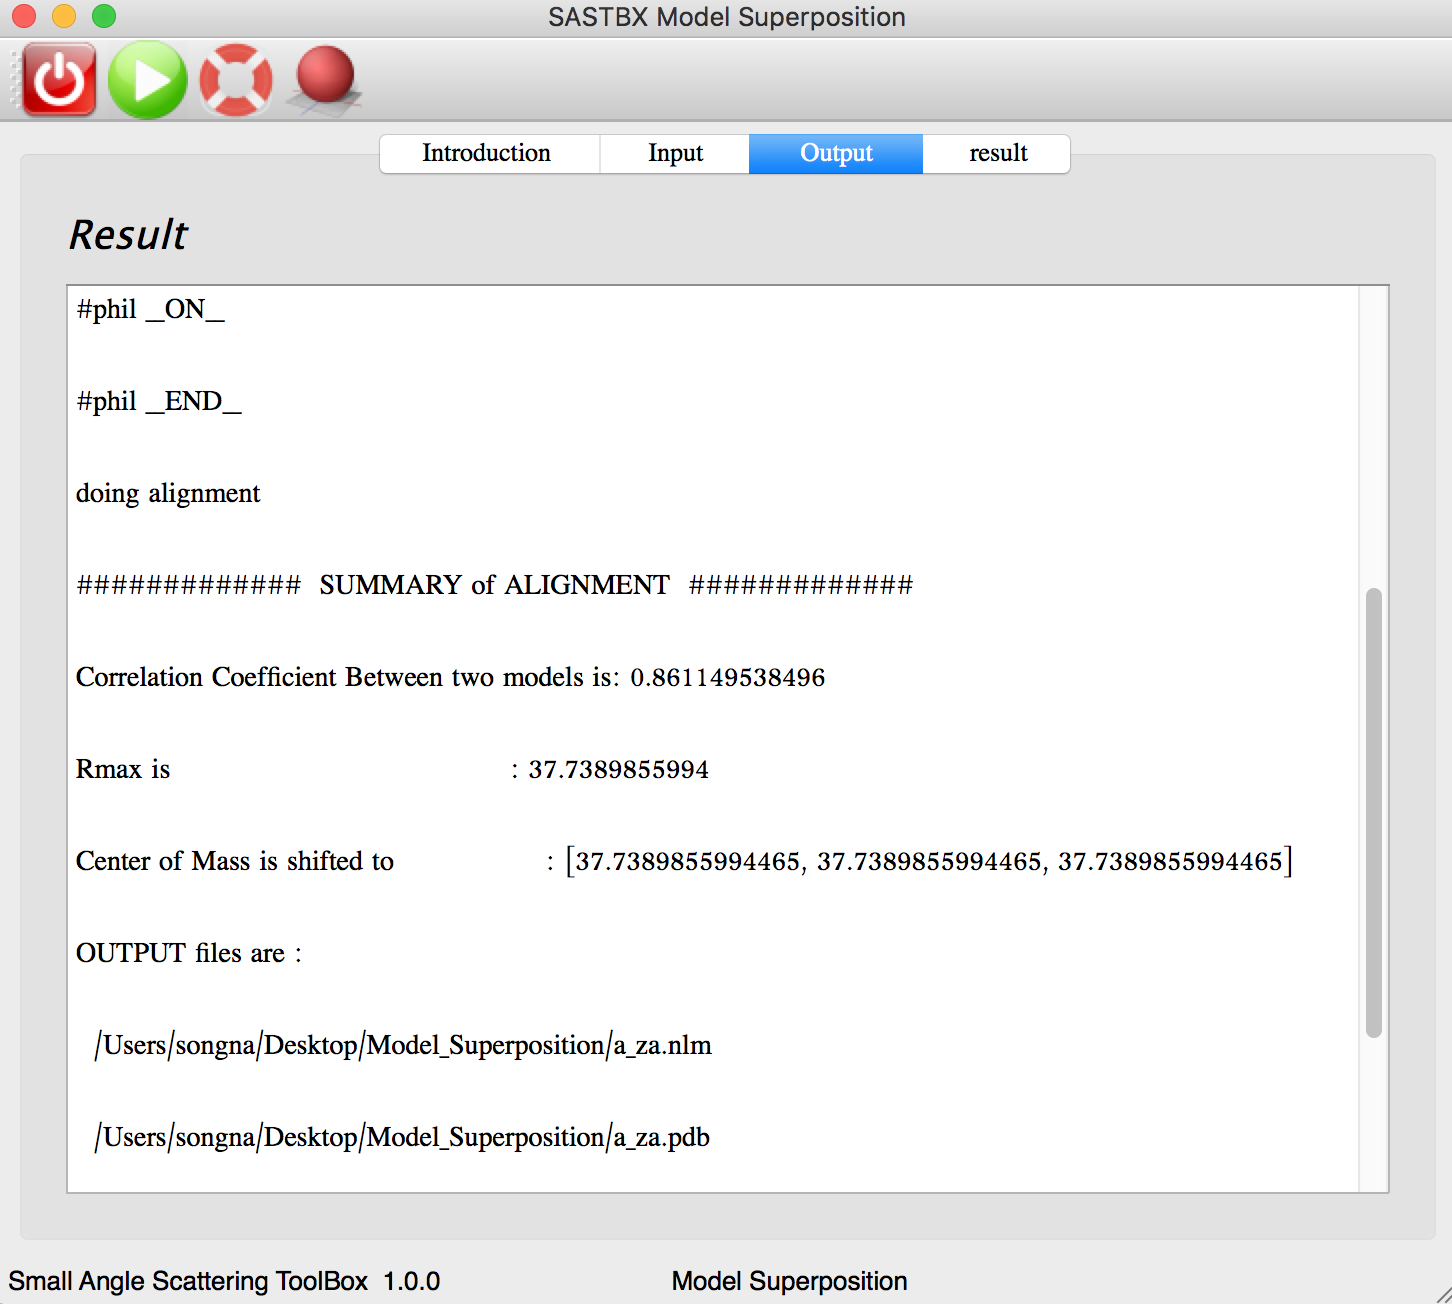
The result can be seen in the result tab:
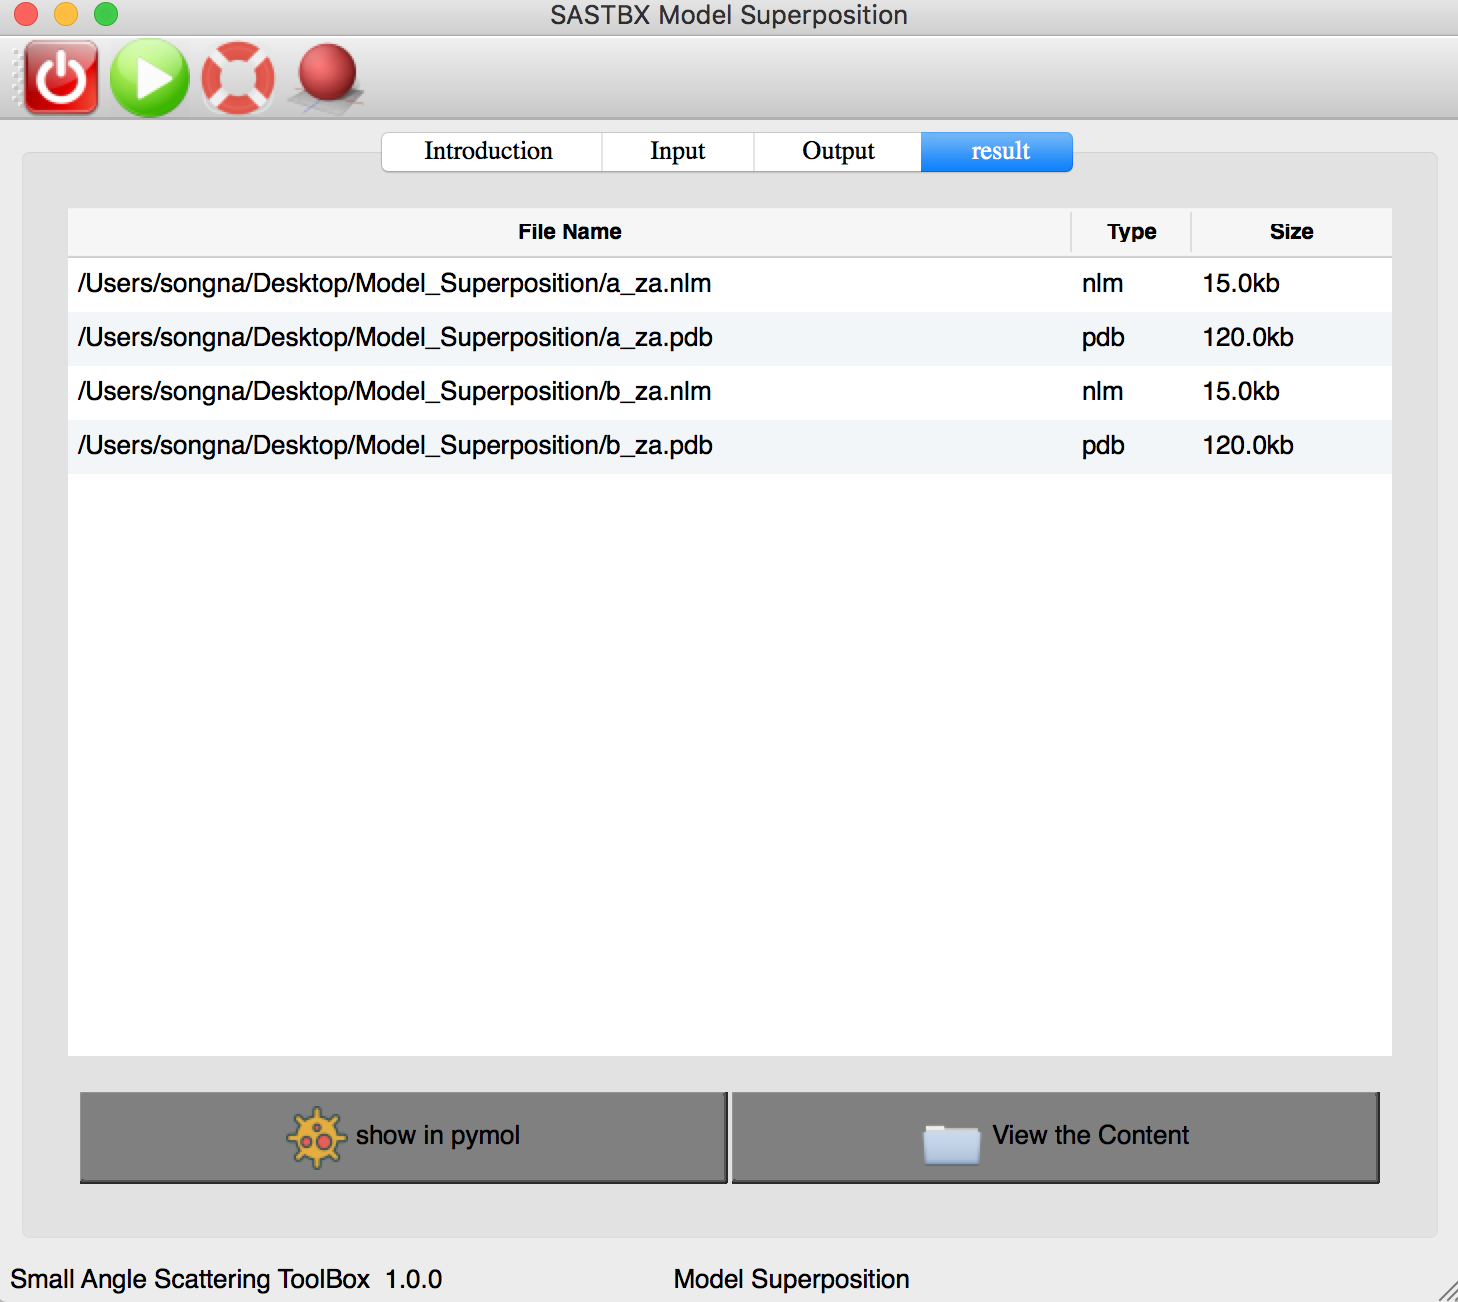
You can explore the content of each result file by seen the content or show in pymol.

You can seen the superpose result by click “pymol” button in the toolbar.
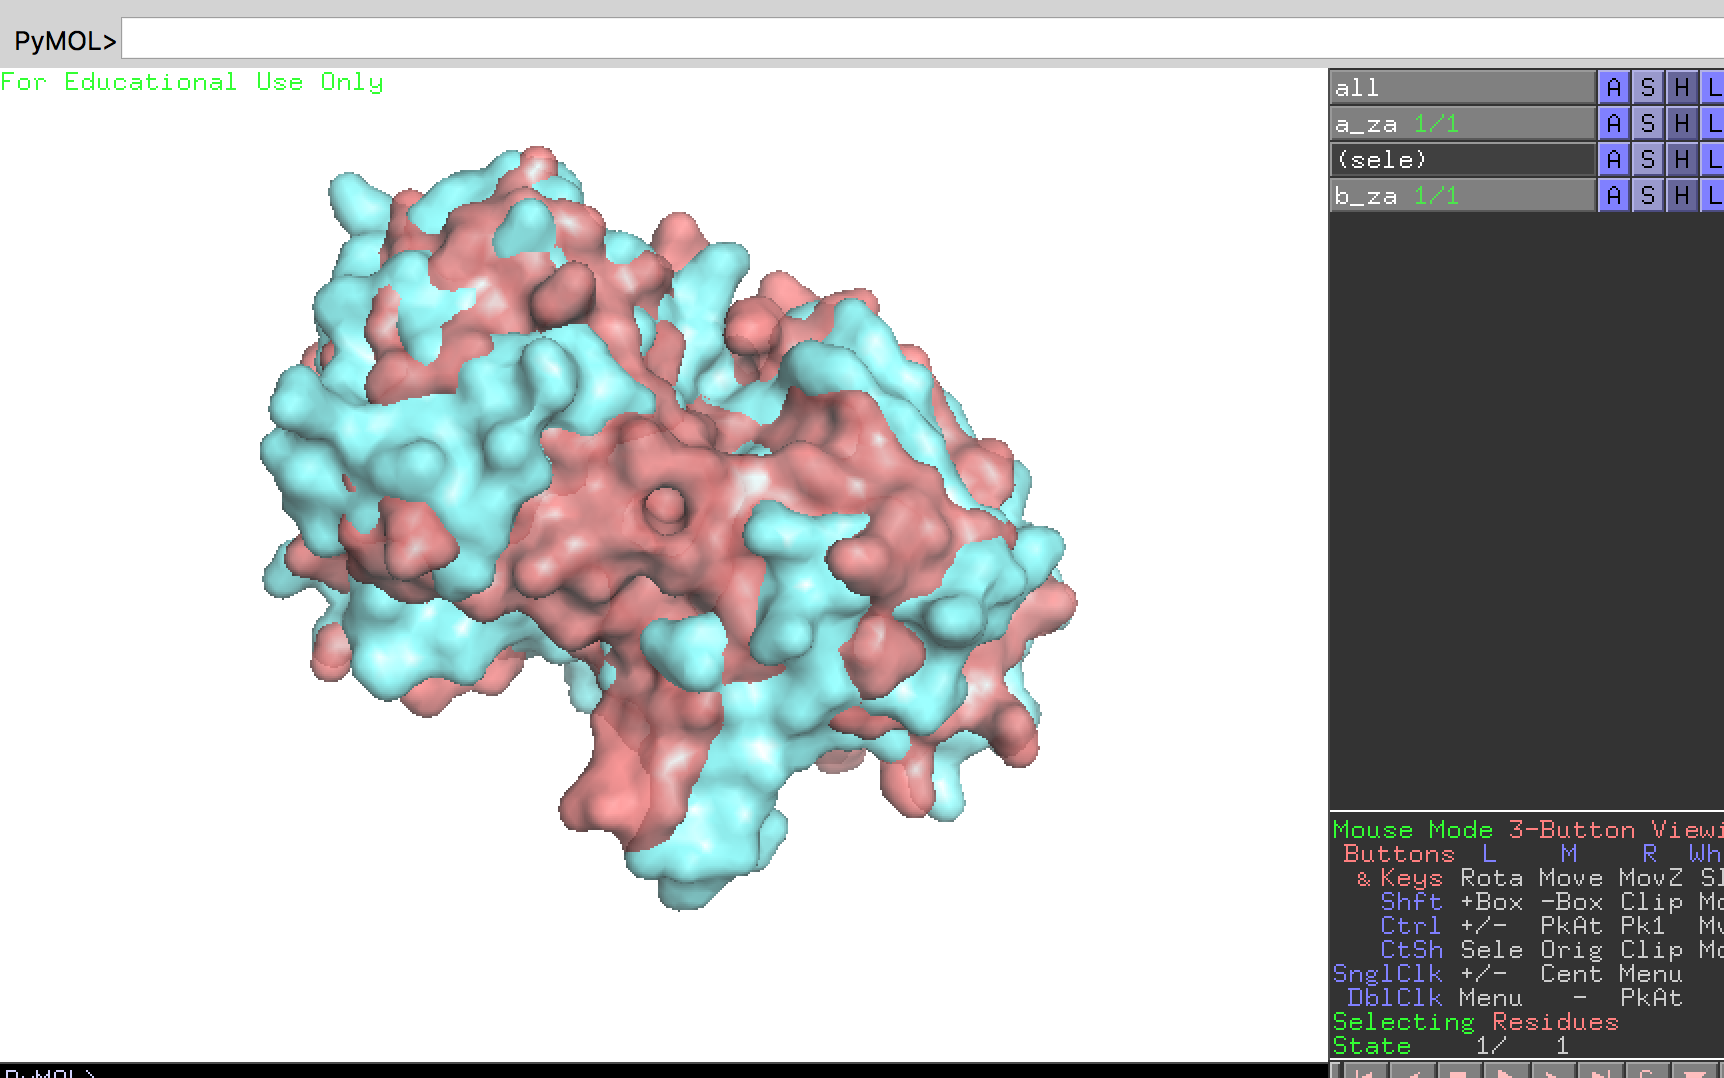
Two protein are superposed.
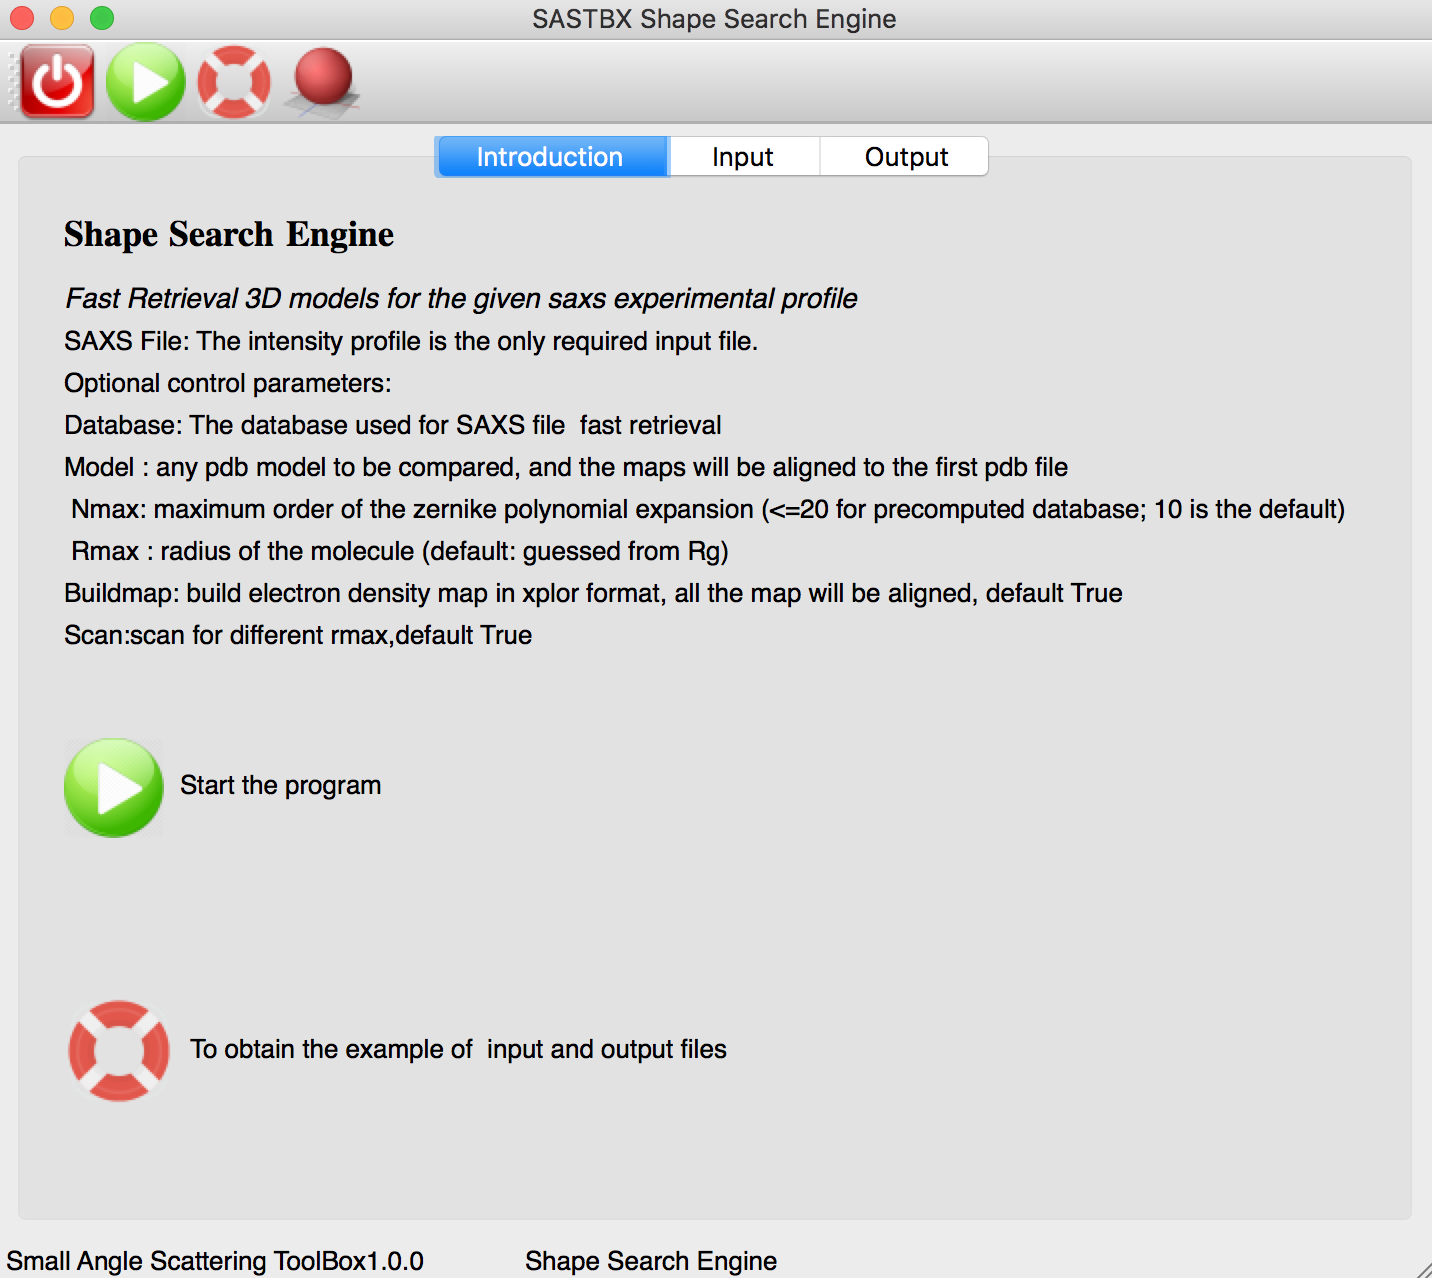
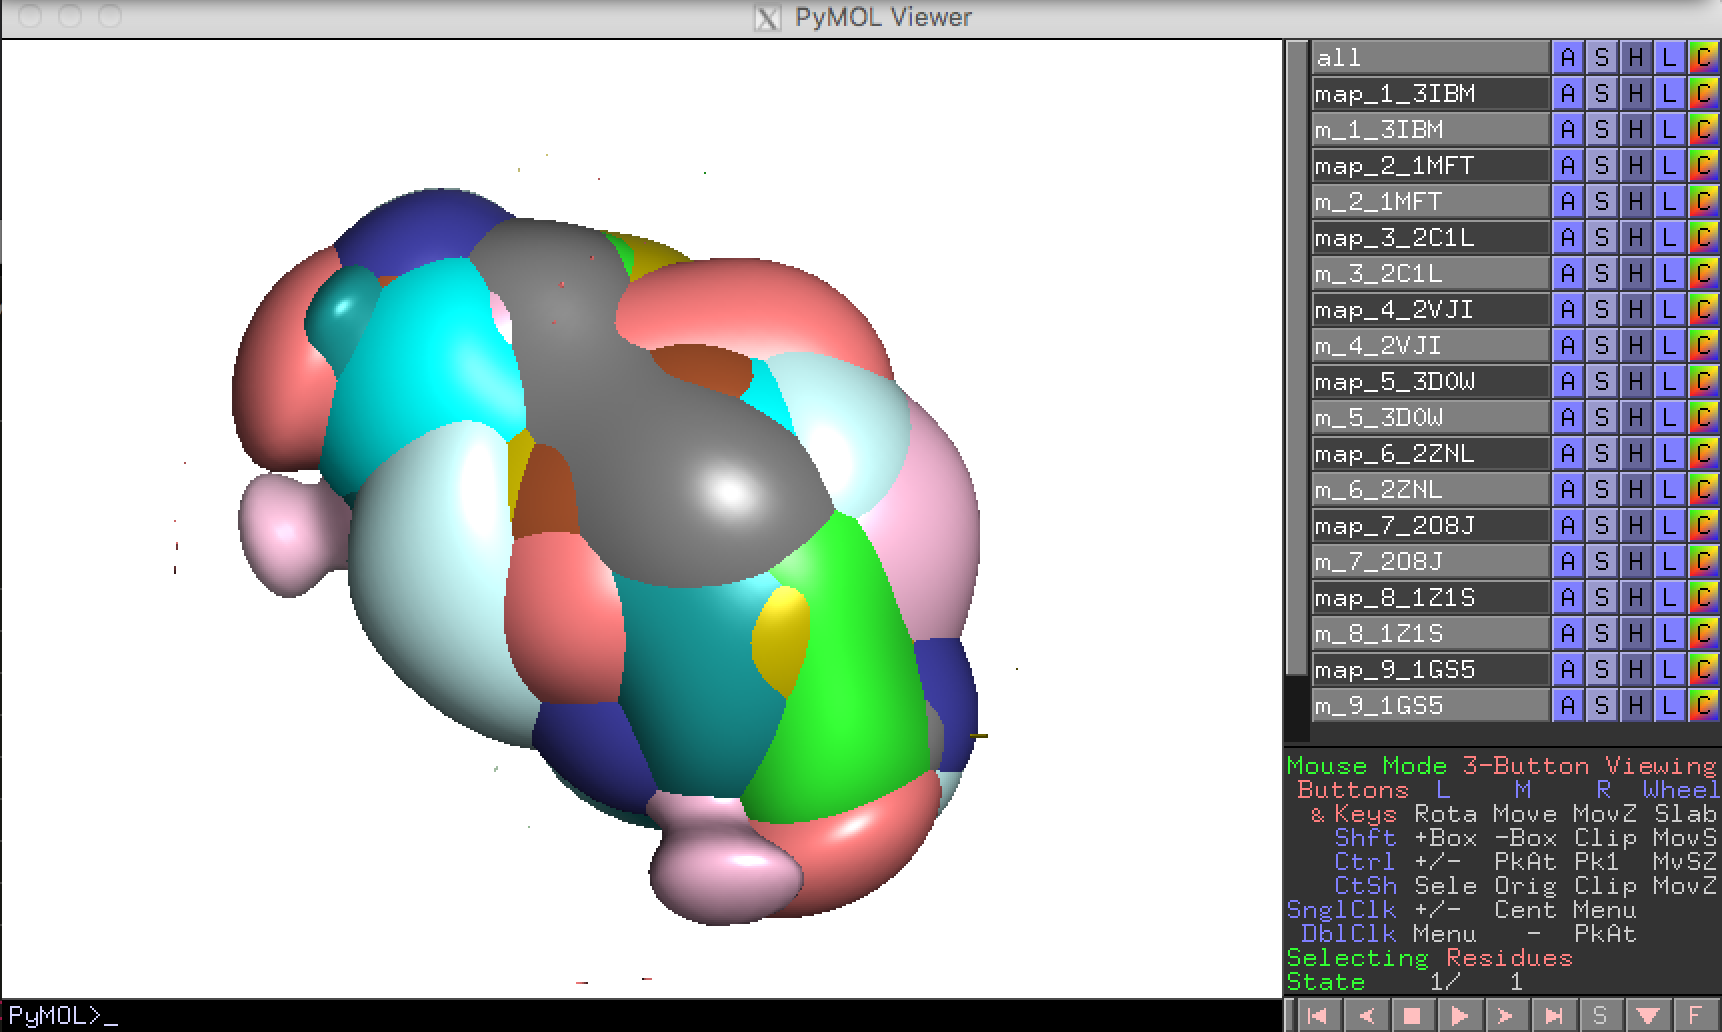
Shape Search Engine
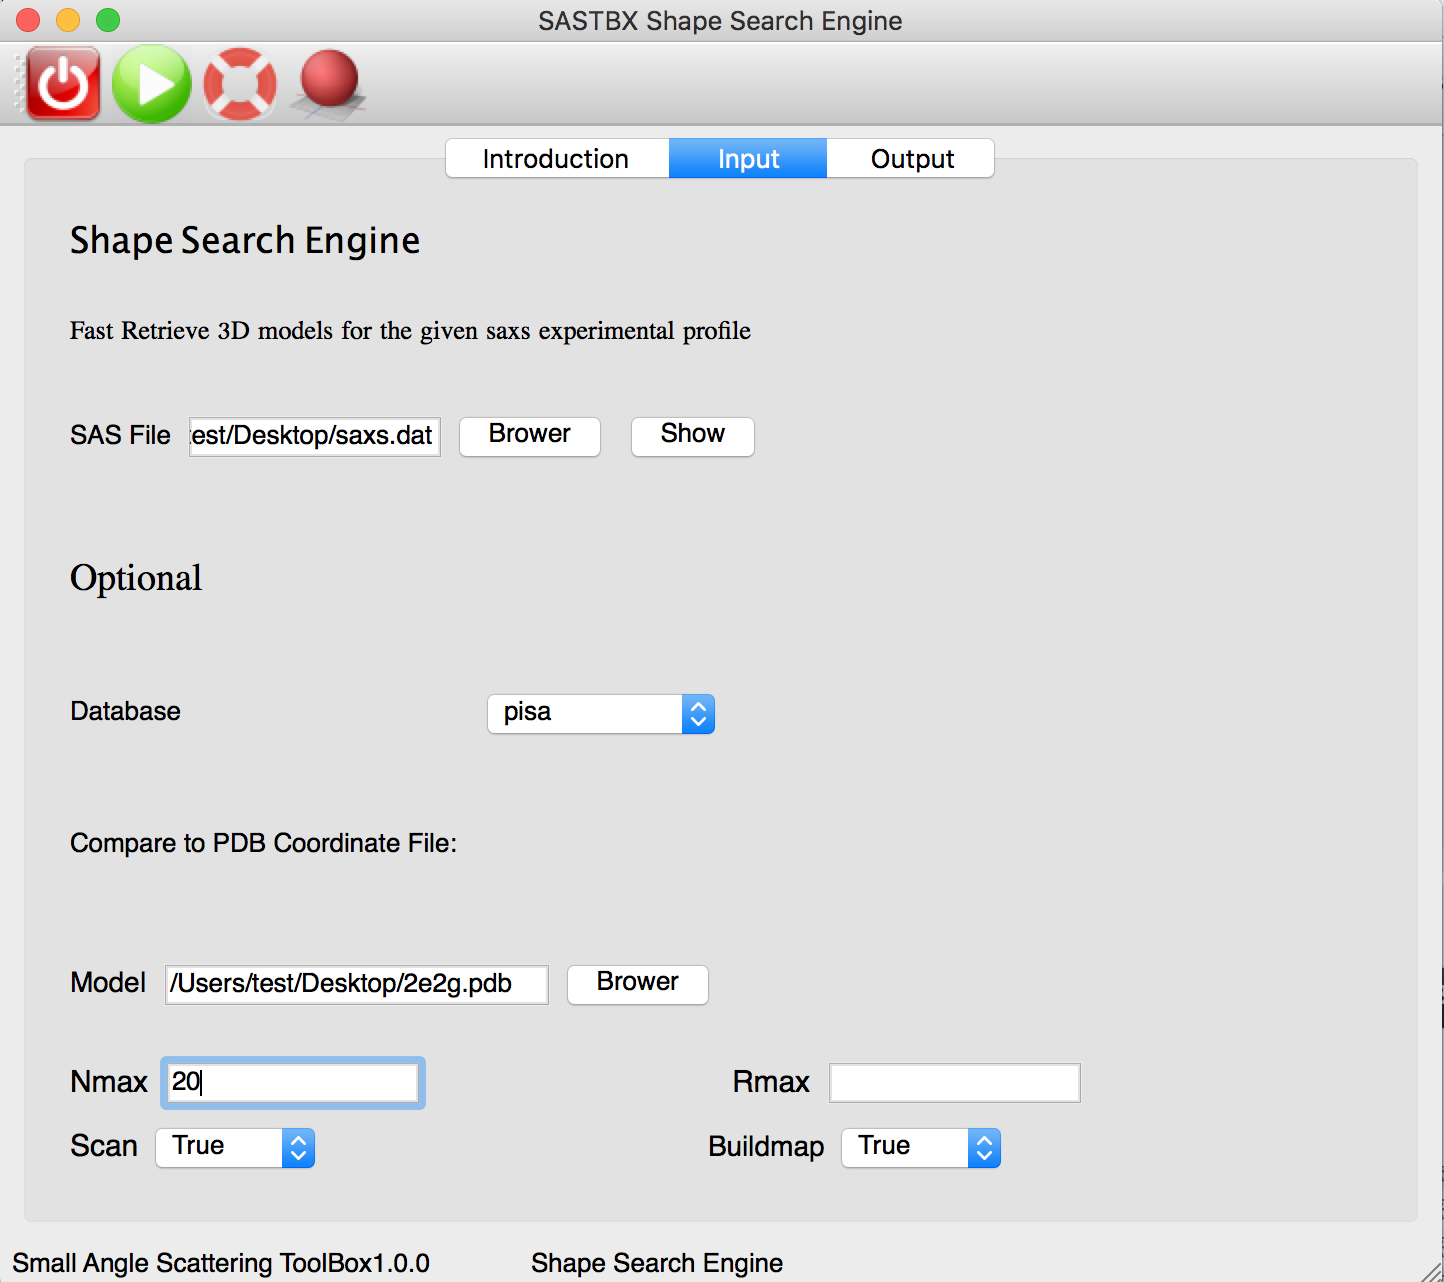
Fast retrieval 3D models for the given says experimental profile.
The instruction tab explain every parameters of the input tab.
Input the file and parameters:
The the program will start with clicking ‘run’ button. And the log can be seen in the widget.
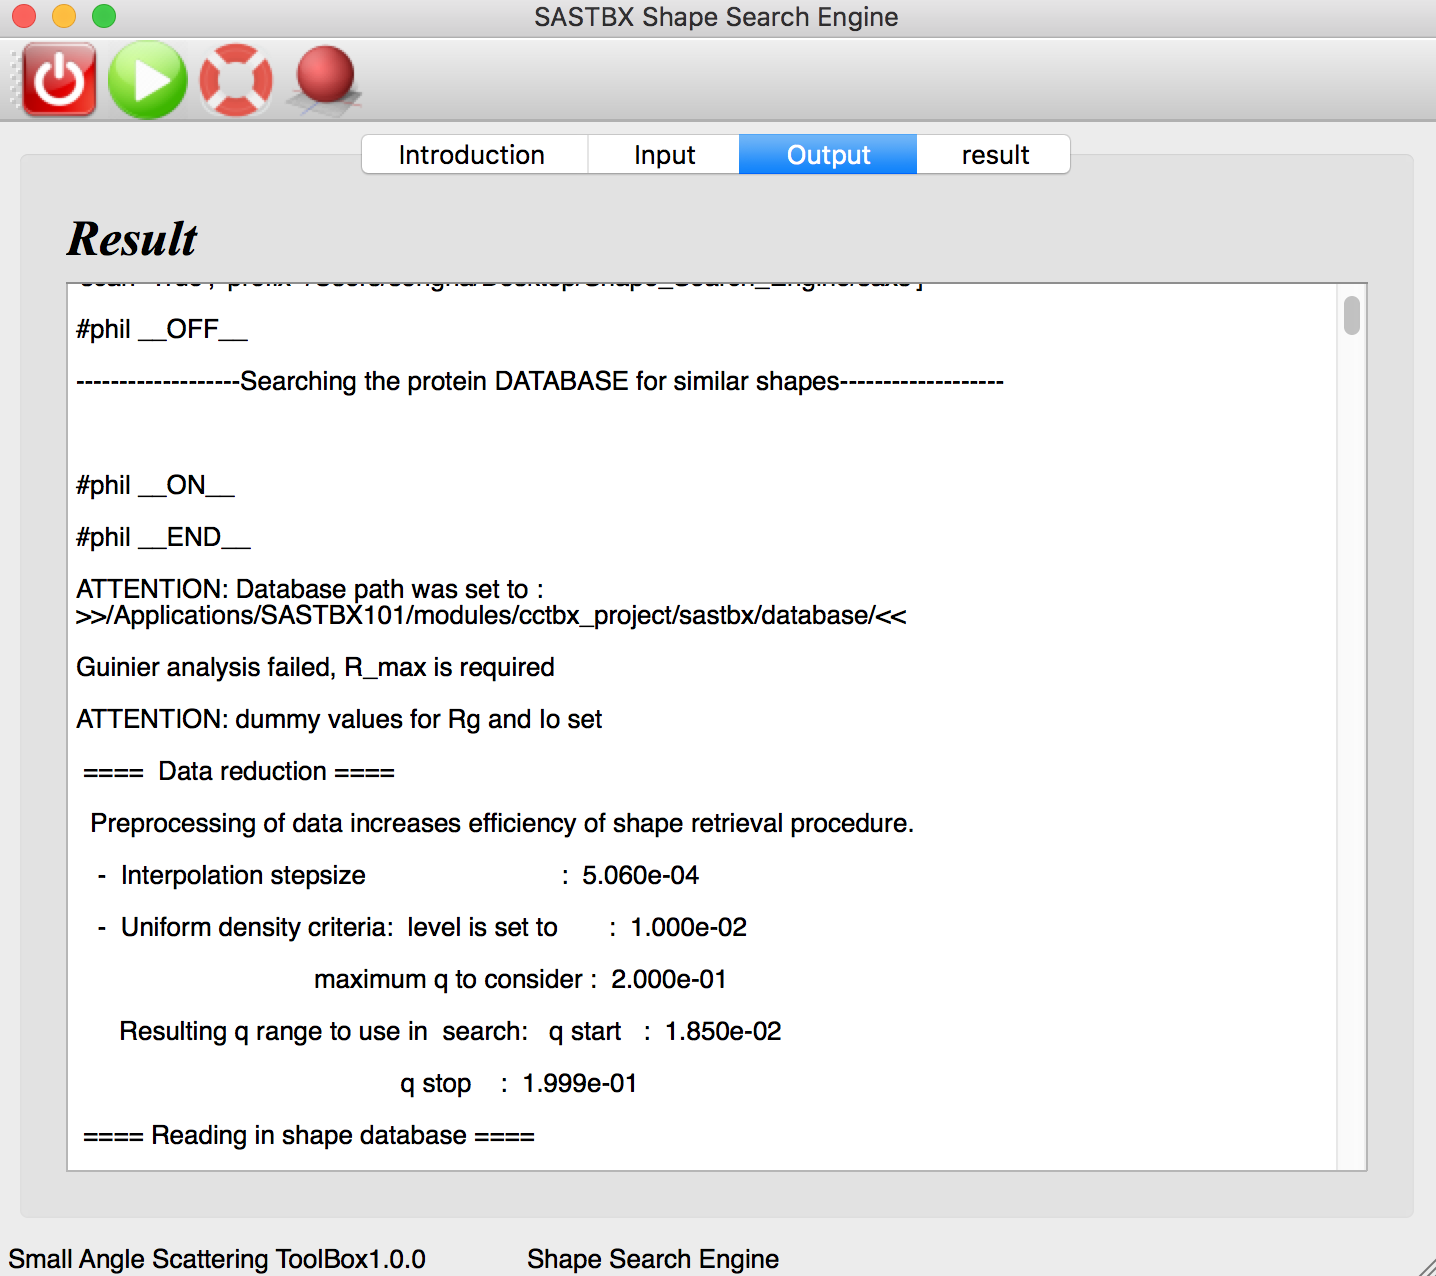
The result can be seen in the result tab:
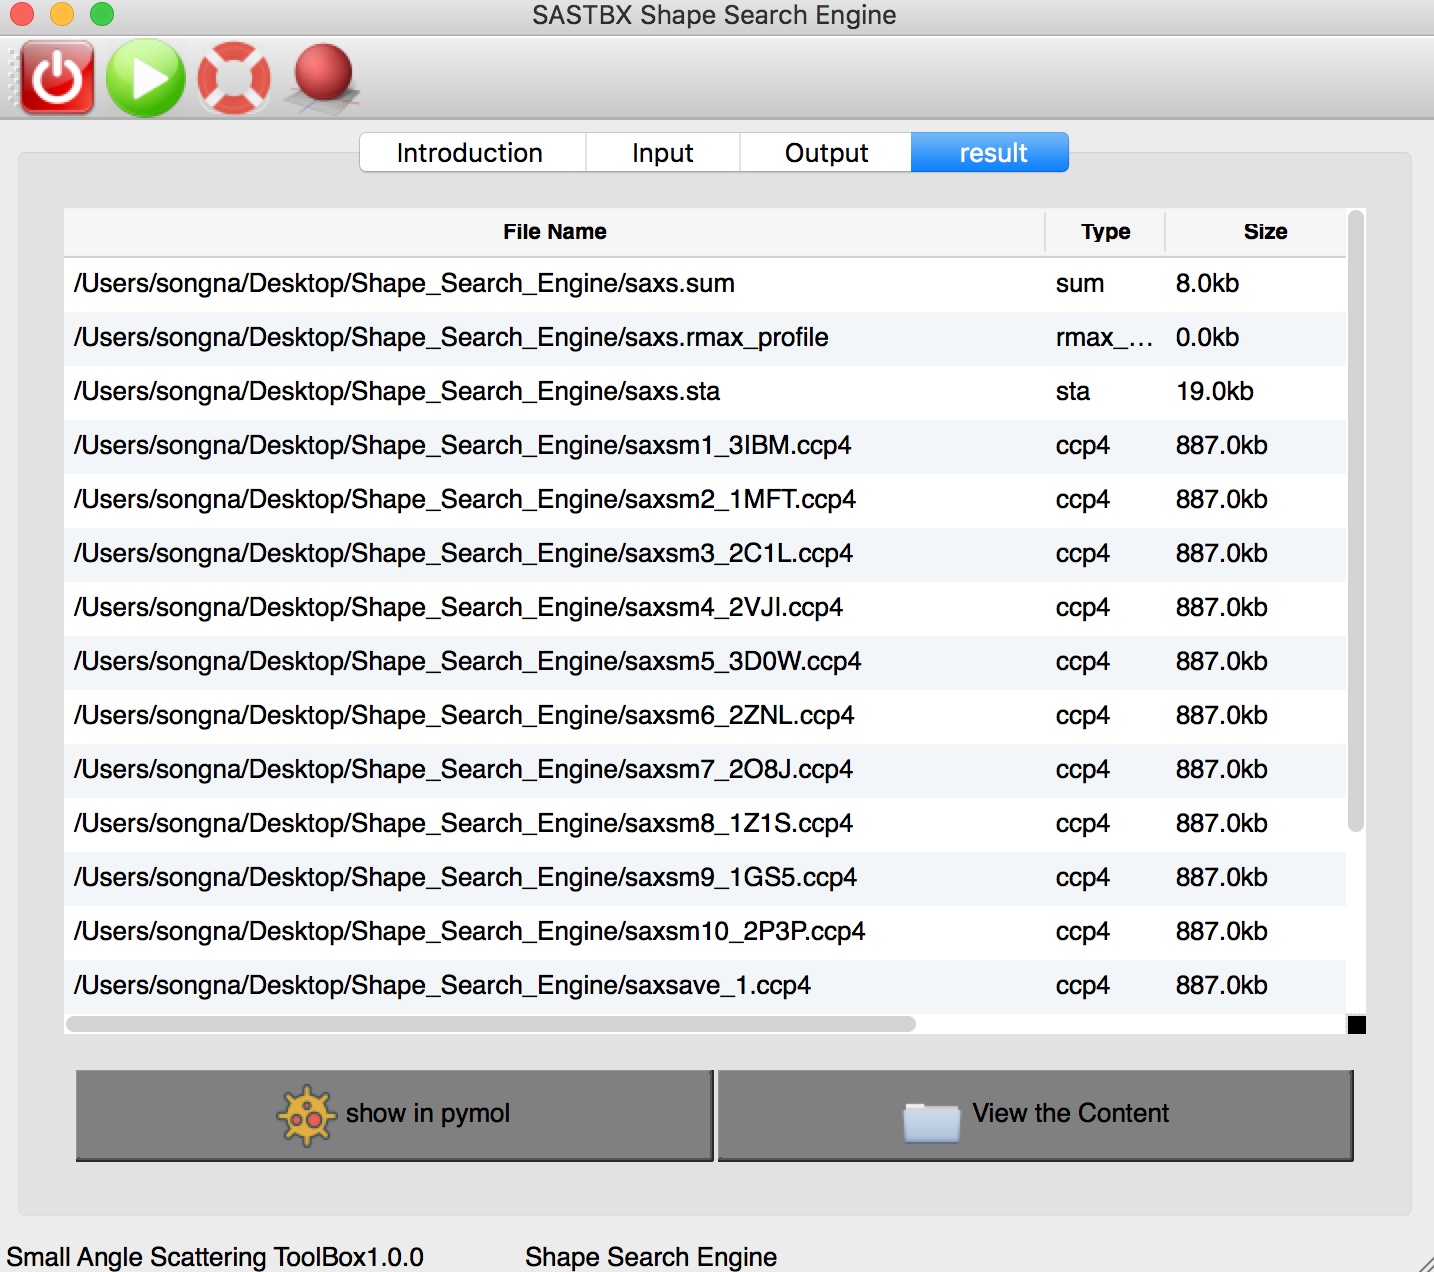
These 10 maps are the best results that match the input SAXS file in the database.
You can explore the content of each result file by looking through the content or show it in pymol.
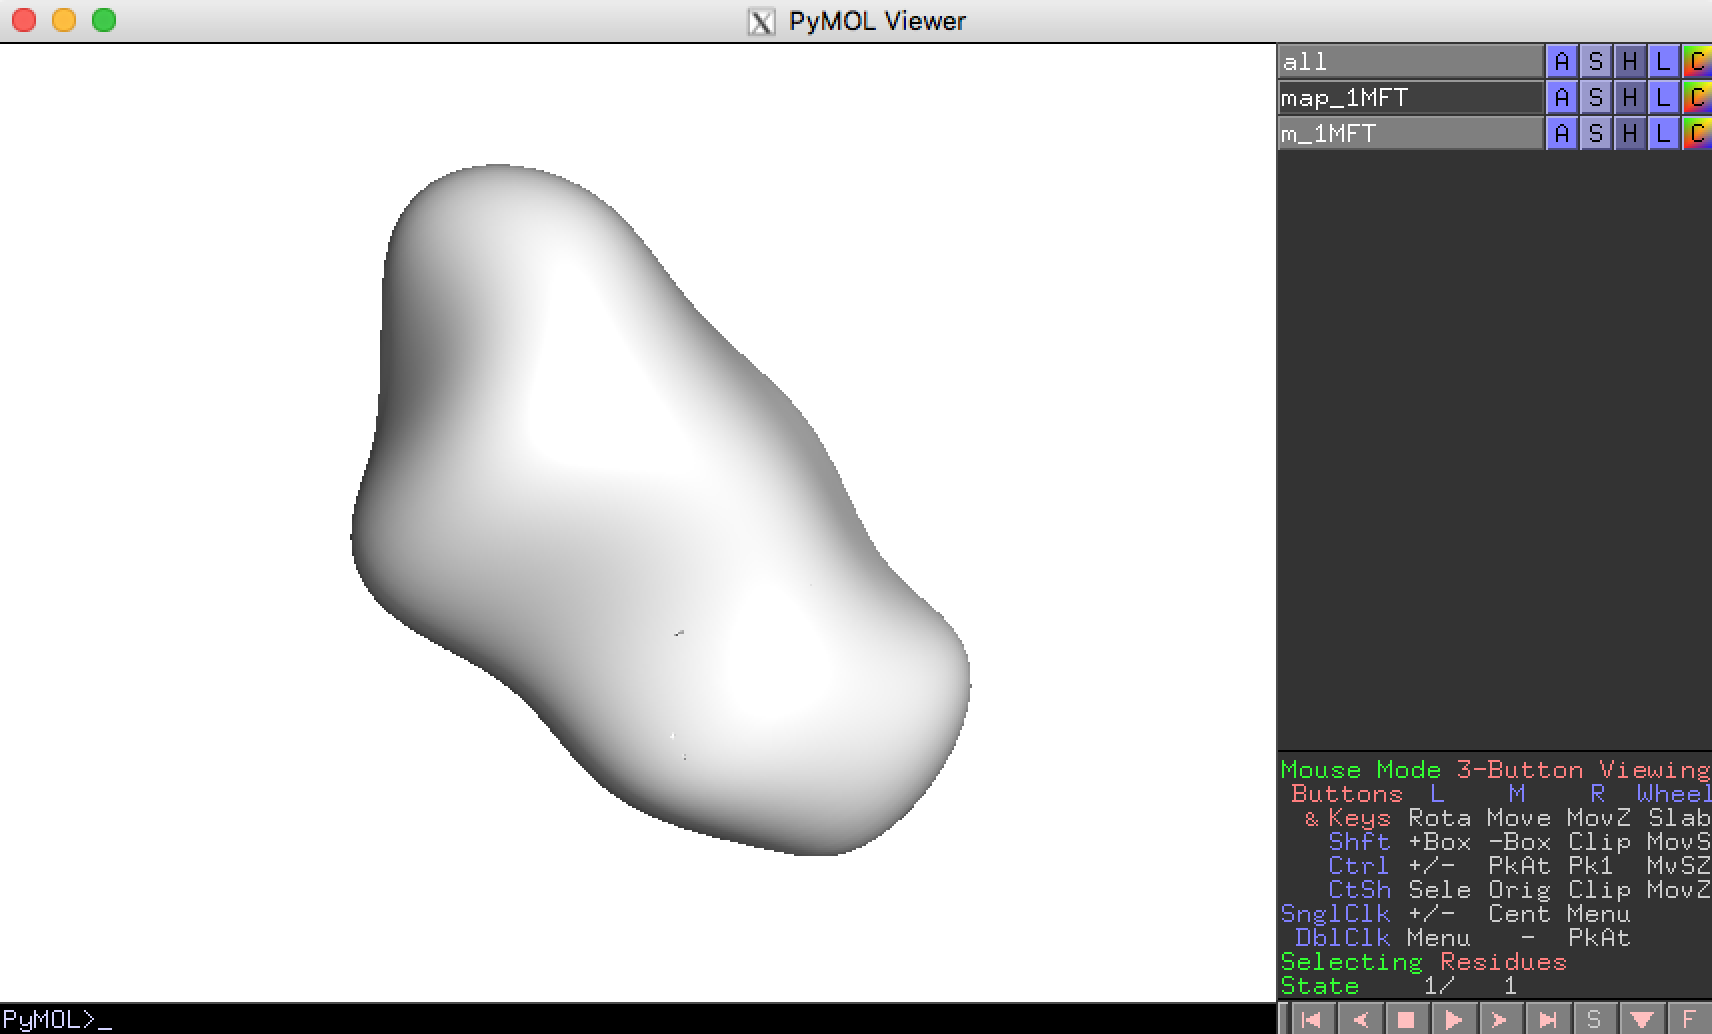
You can seen the result by click “pymol” button in the toolbar.
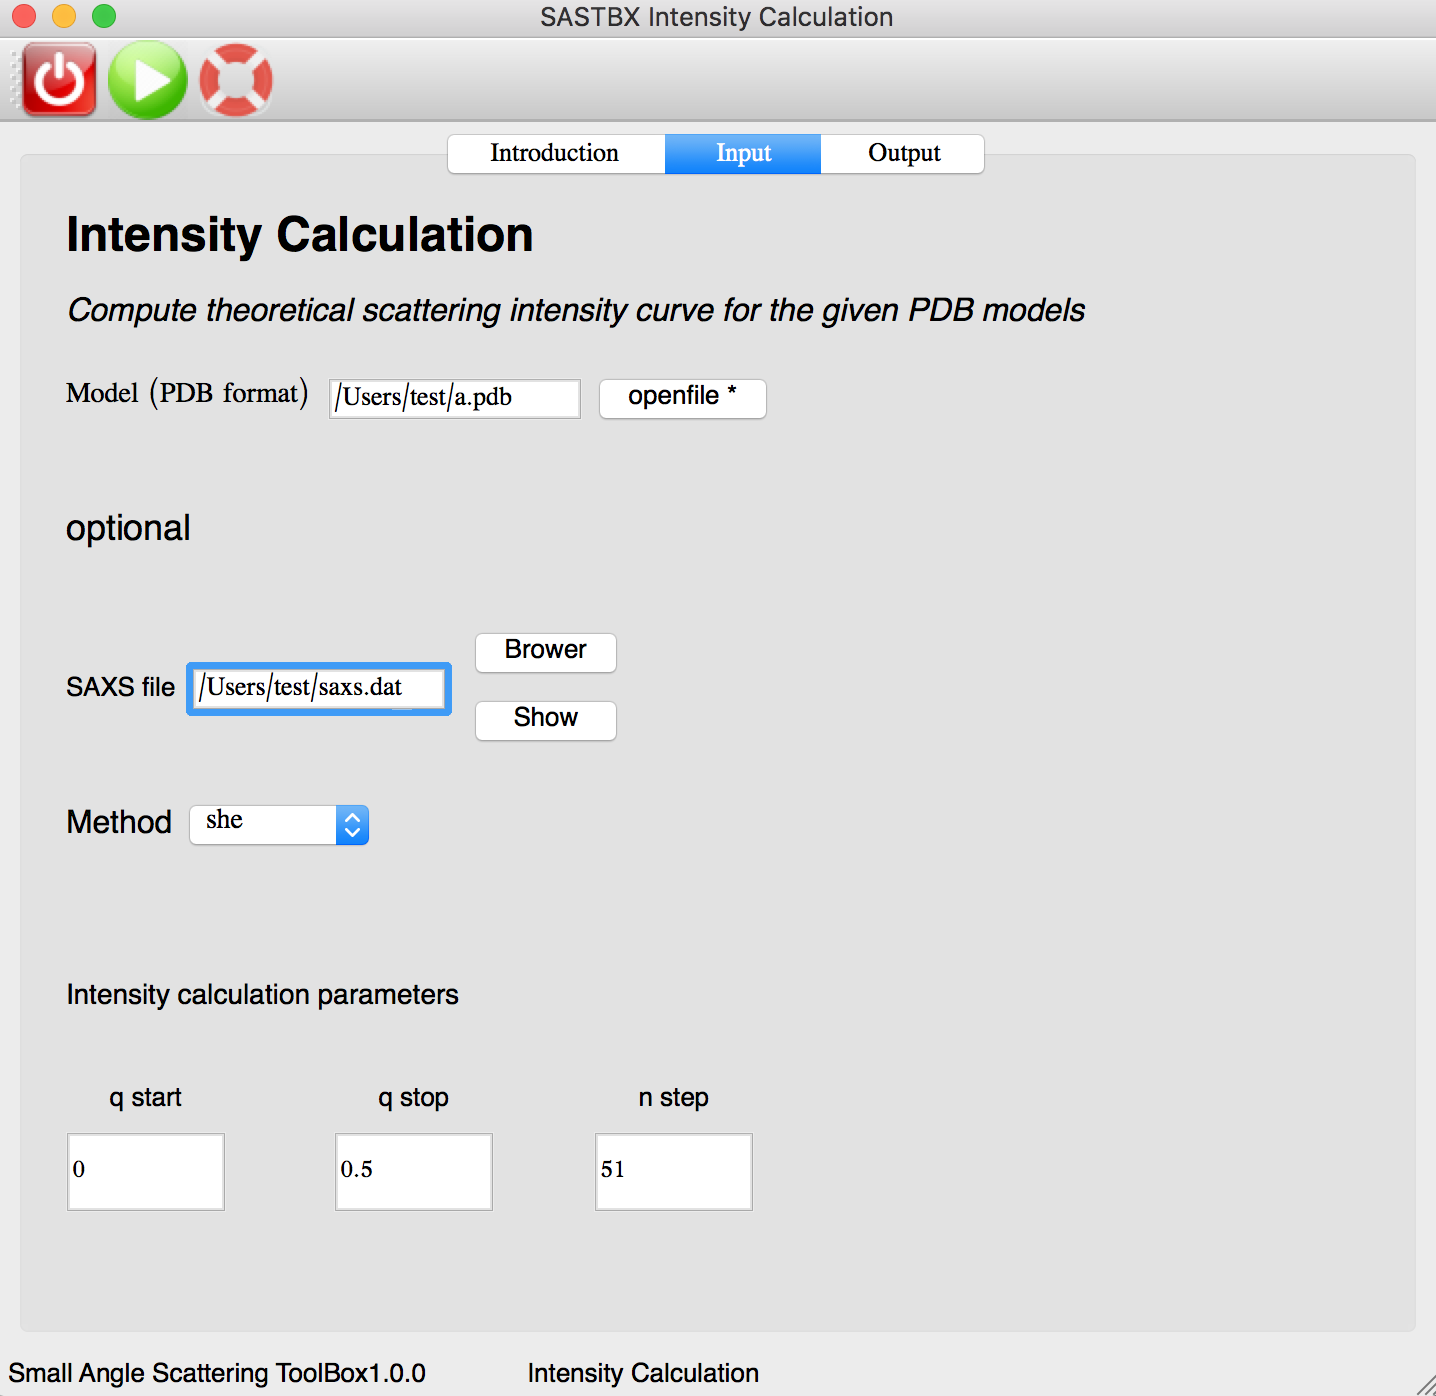
Intensity Calculation
Compute theoretical scattering intensity curve for the given PDB models. The instruction tab explain every parameters of the input tab.

Input the file and parameters:
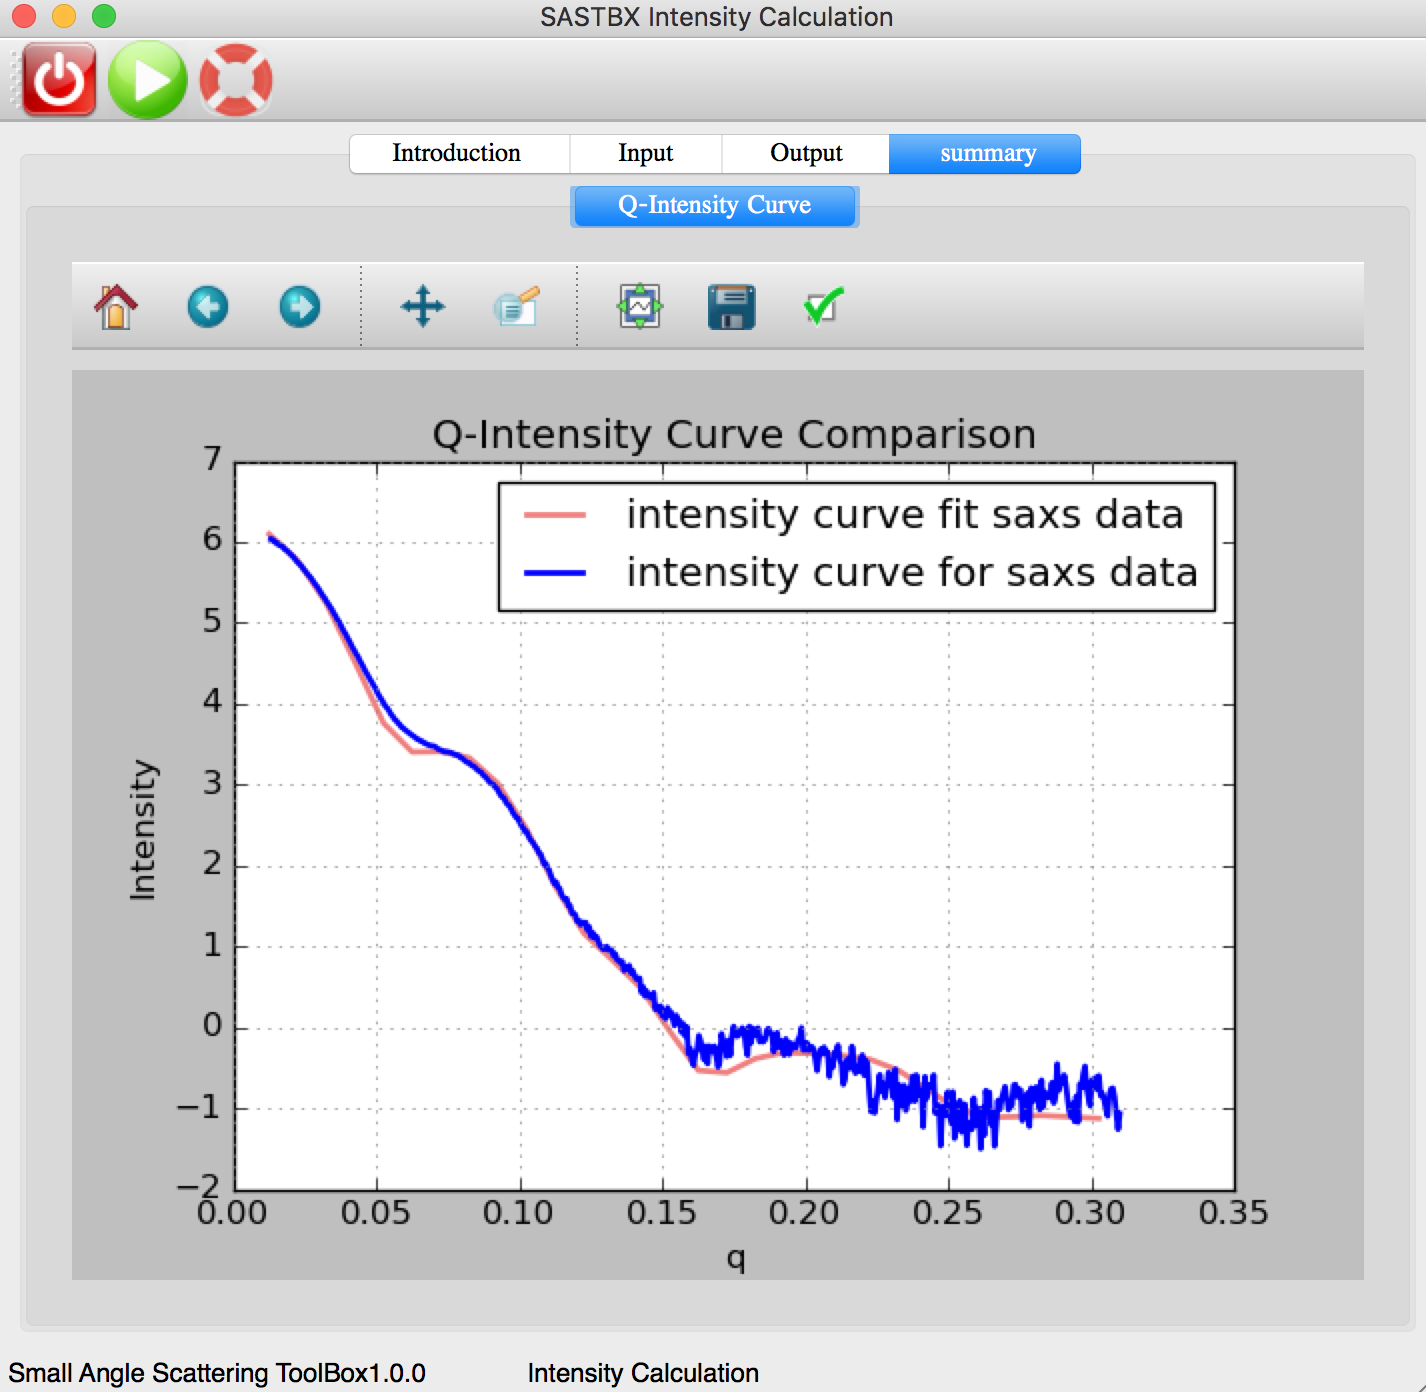
The real time log file:

The intensity curve can be seen in the summary tab:
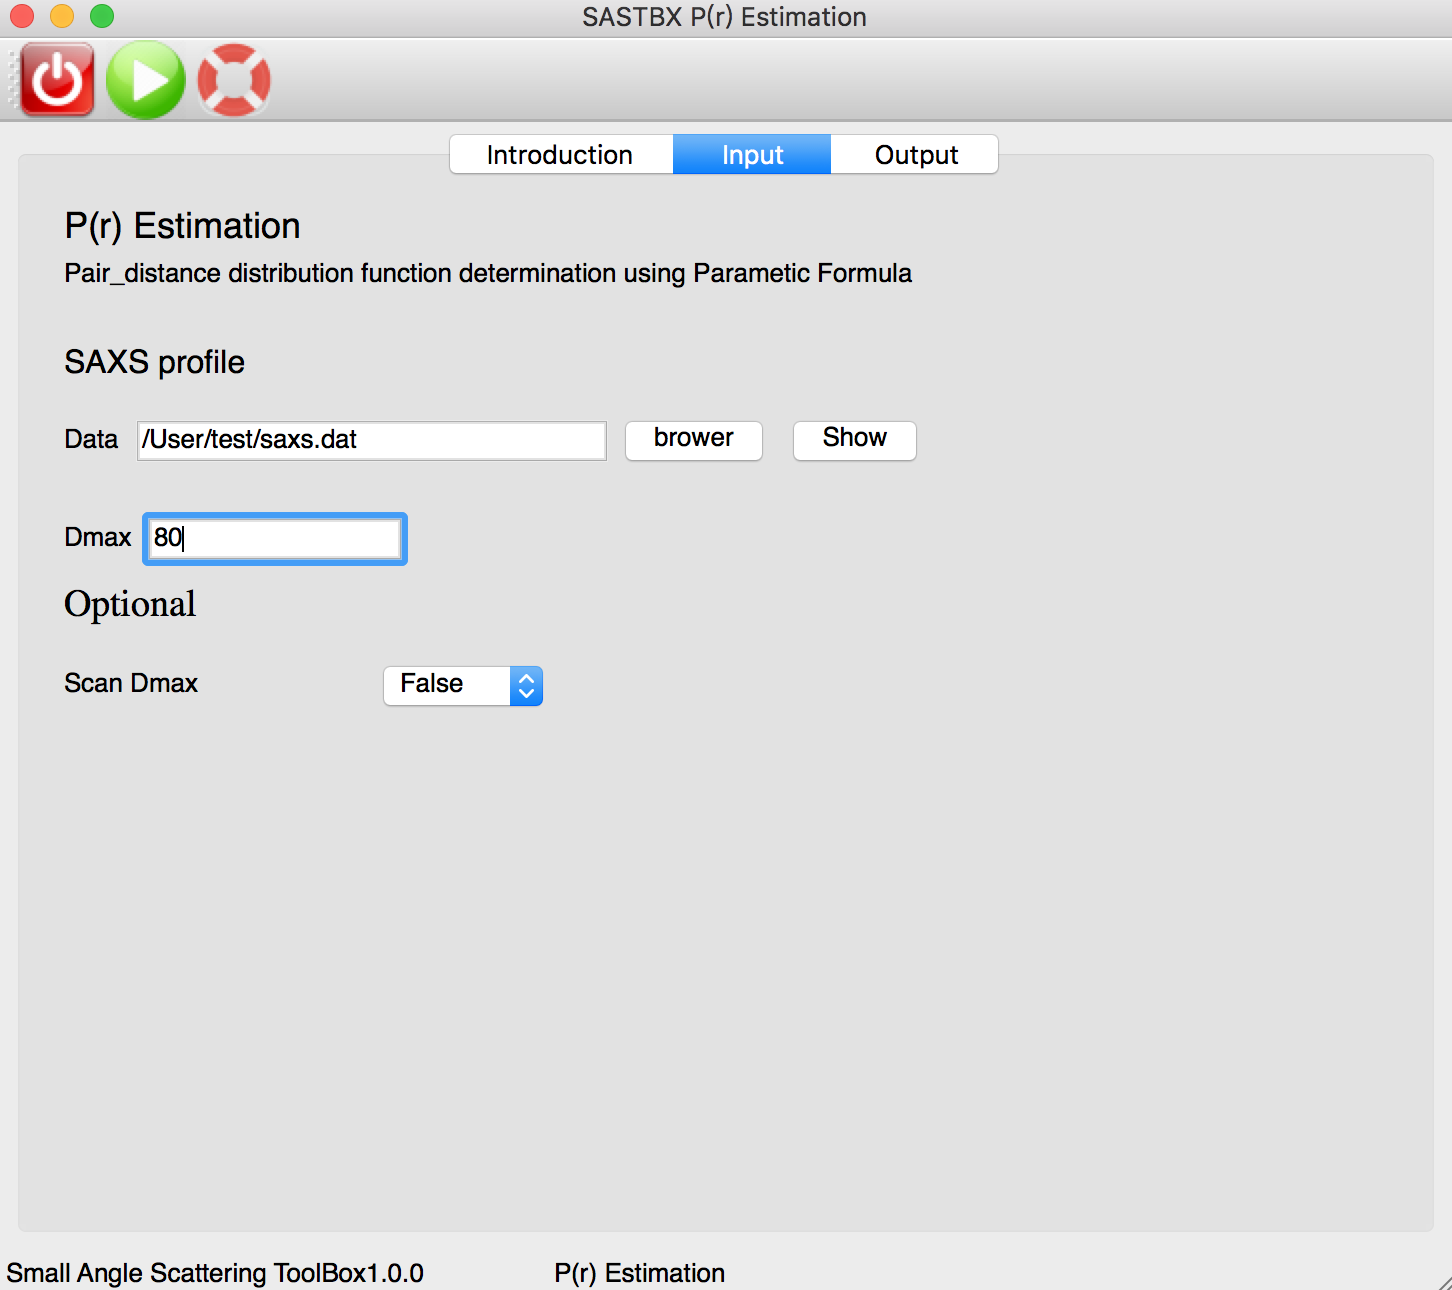
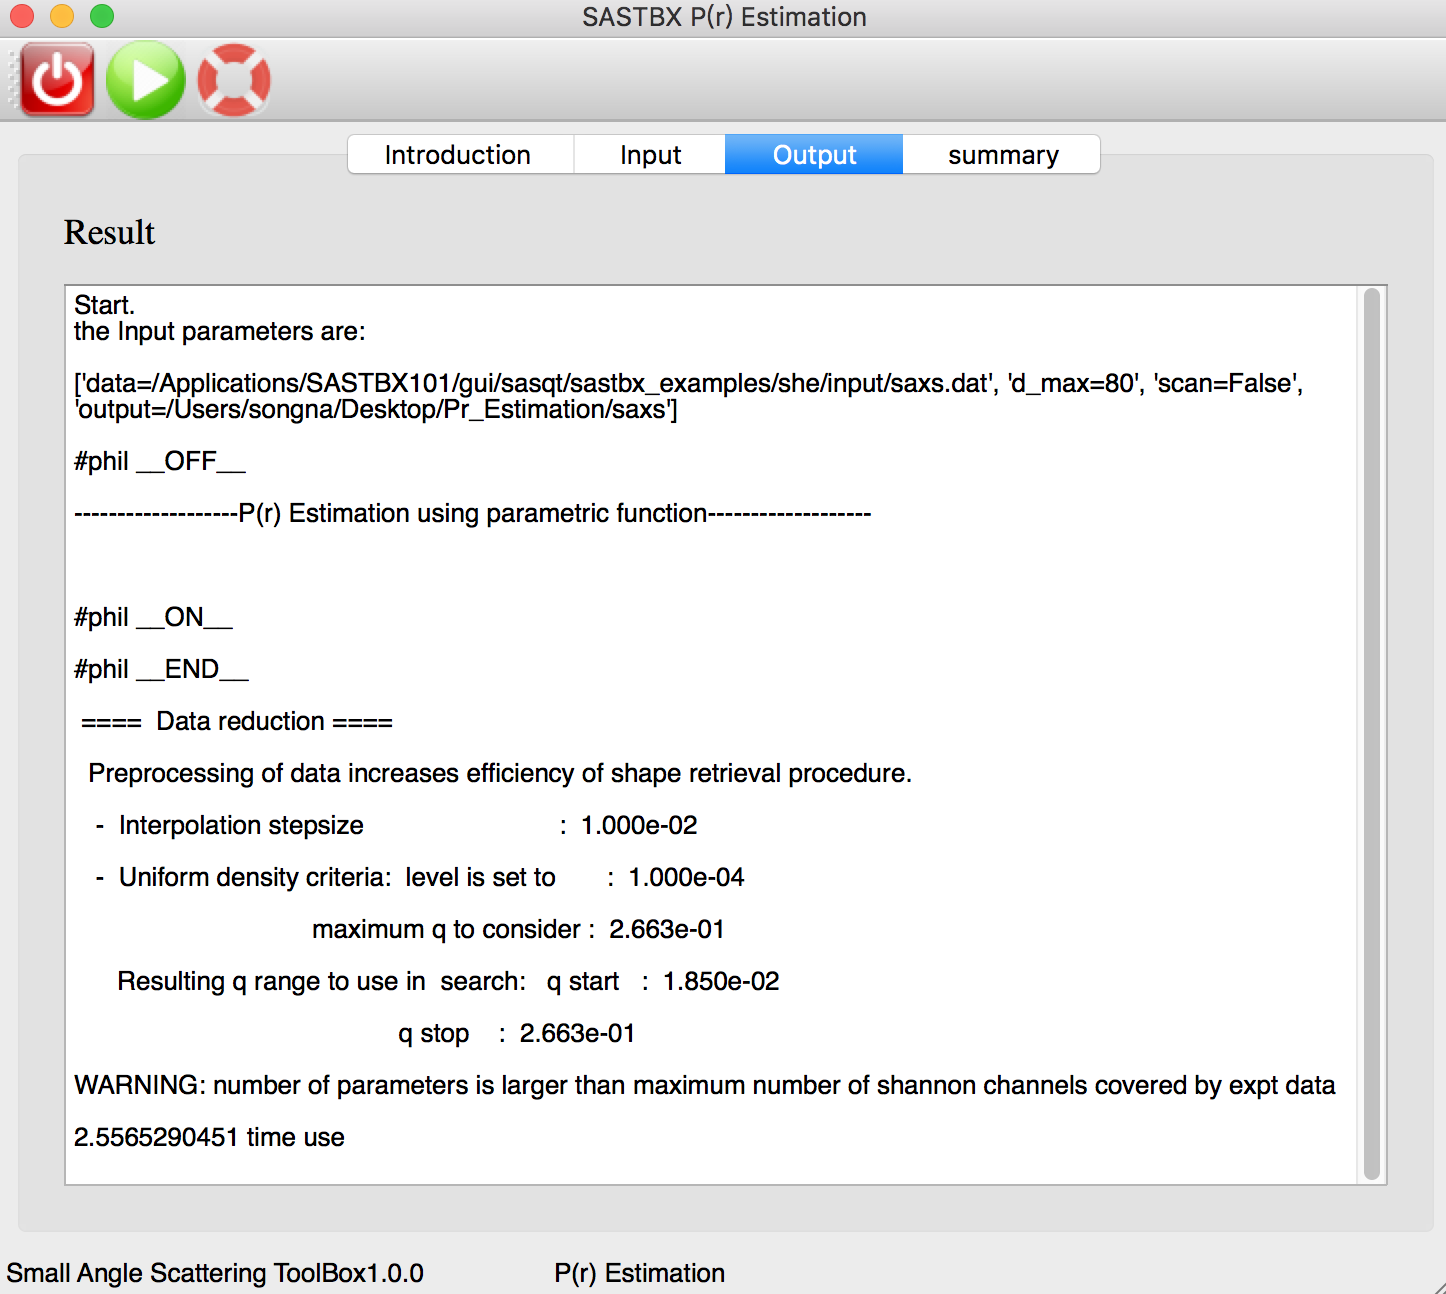
P(r) Estimation
Using Parametic Formula to determinate the pair distance distribution function of saxs file.
The input parameters:
The real time log file:
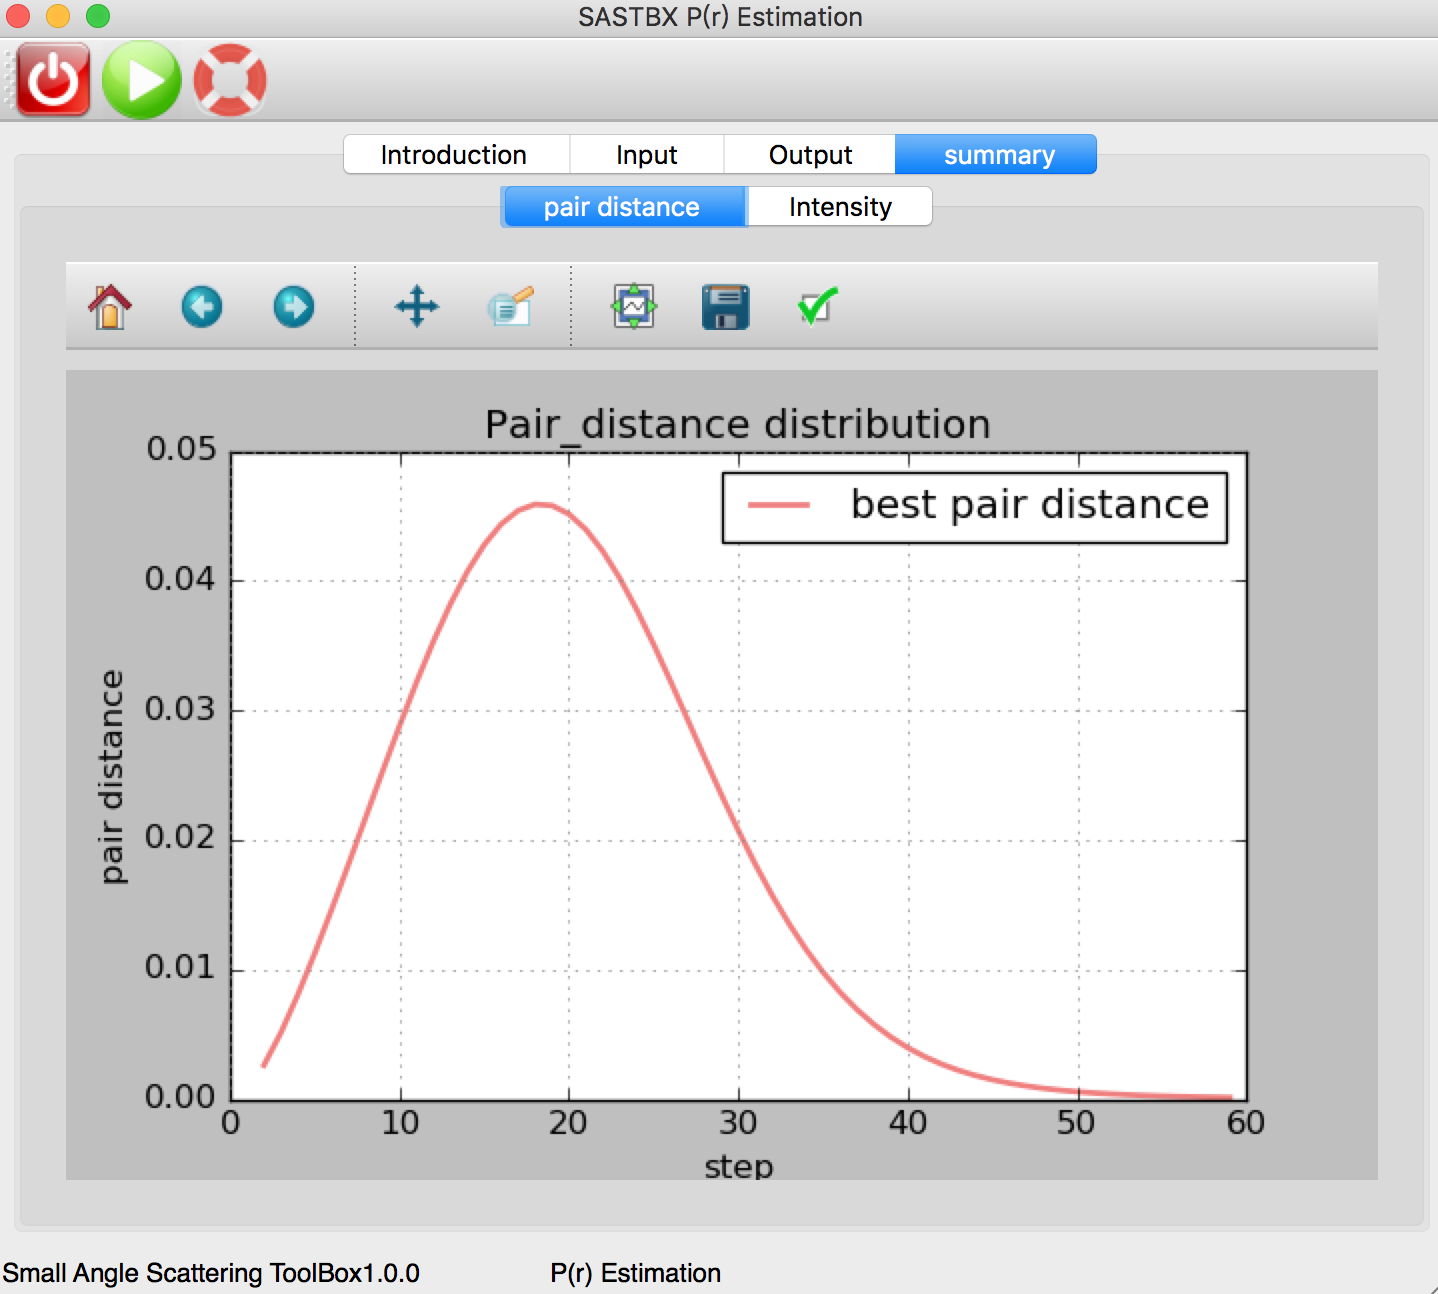
The pair distance curve can be seen in the summary tab:
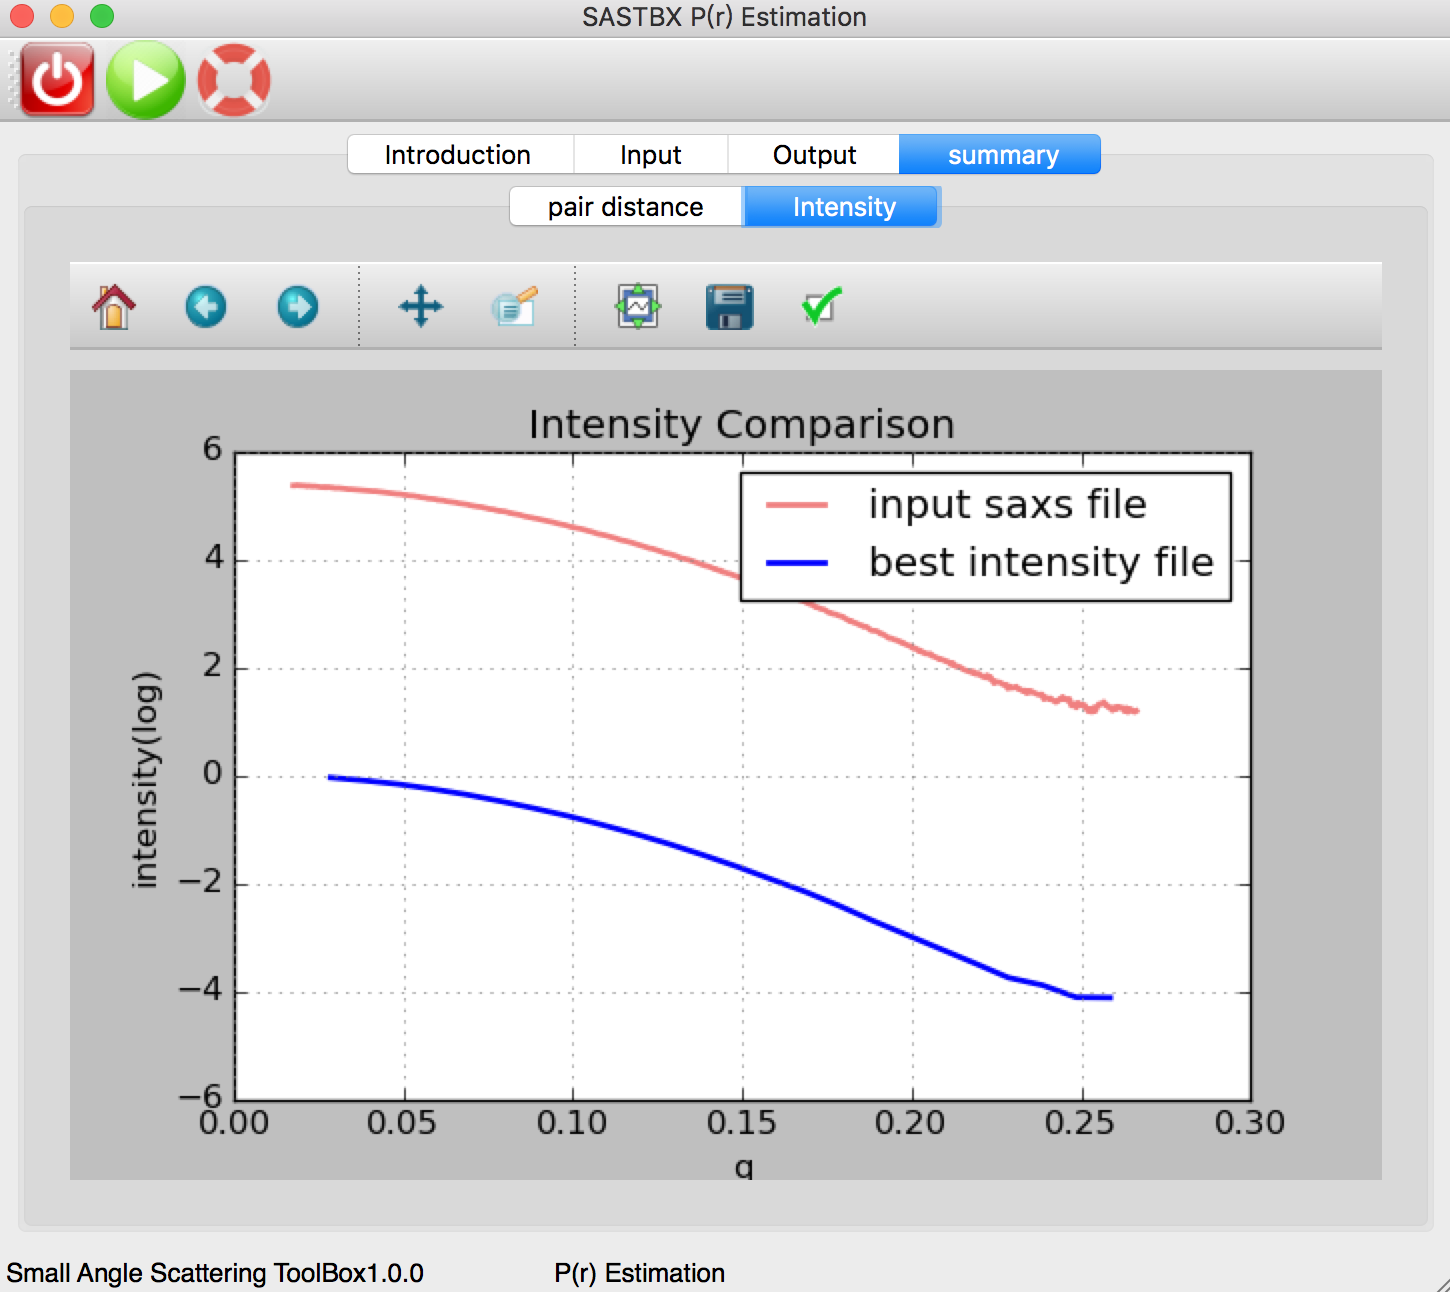
The original intensity curve of saxs file and the best intensity file curve:
Get Help
You can get help of the principle of each function and the tutorial of how to use the application whenever you click the help button:

And you can see:
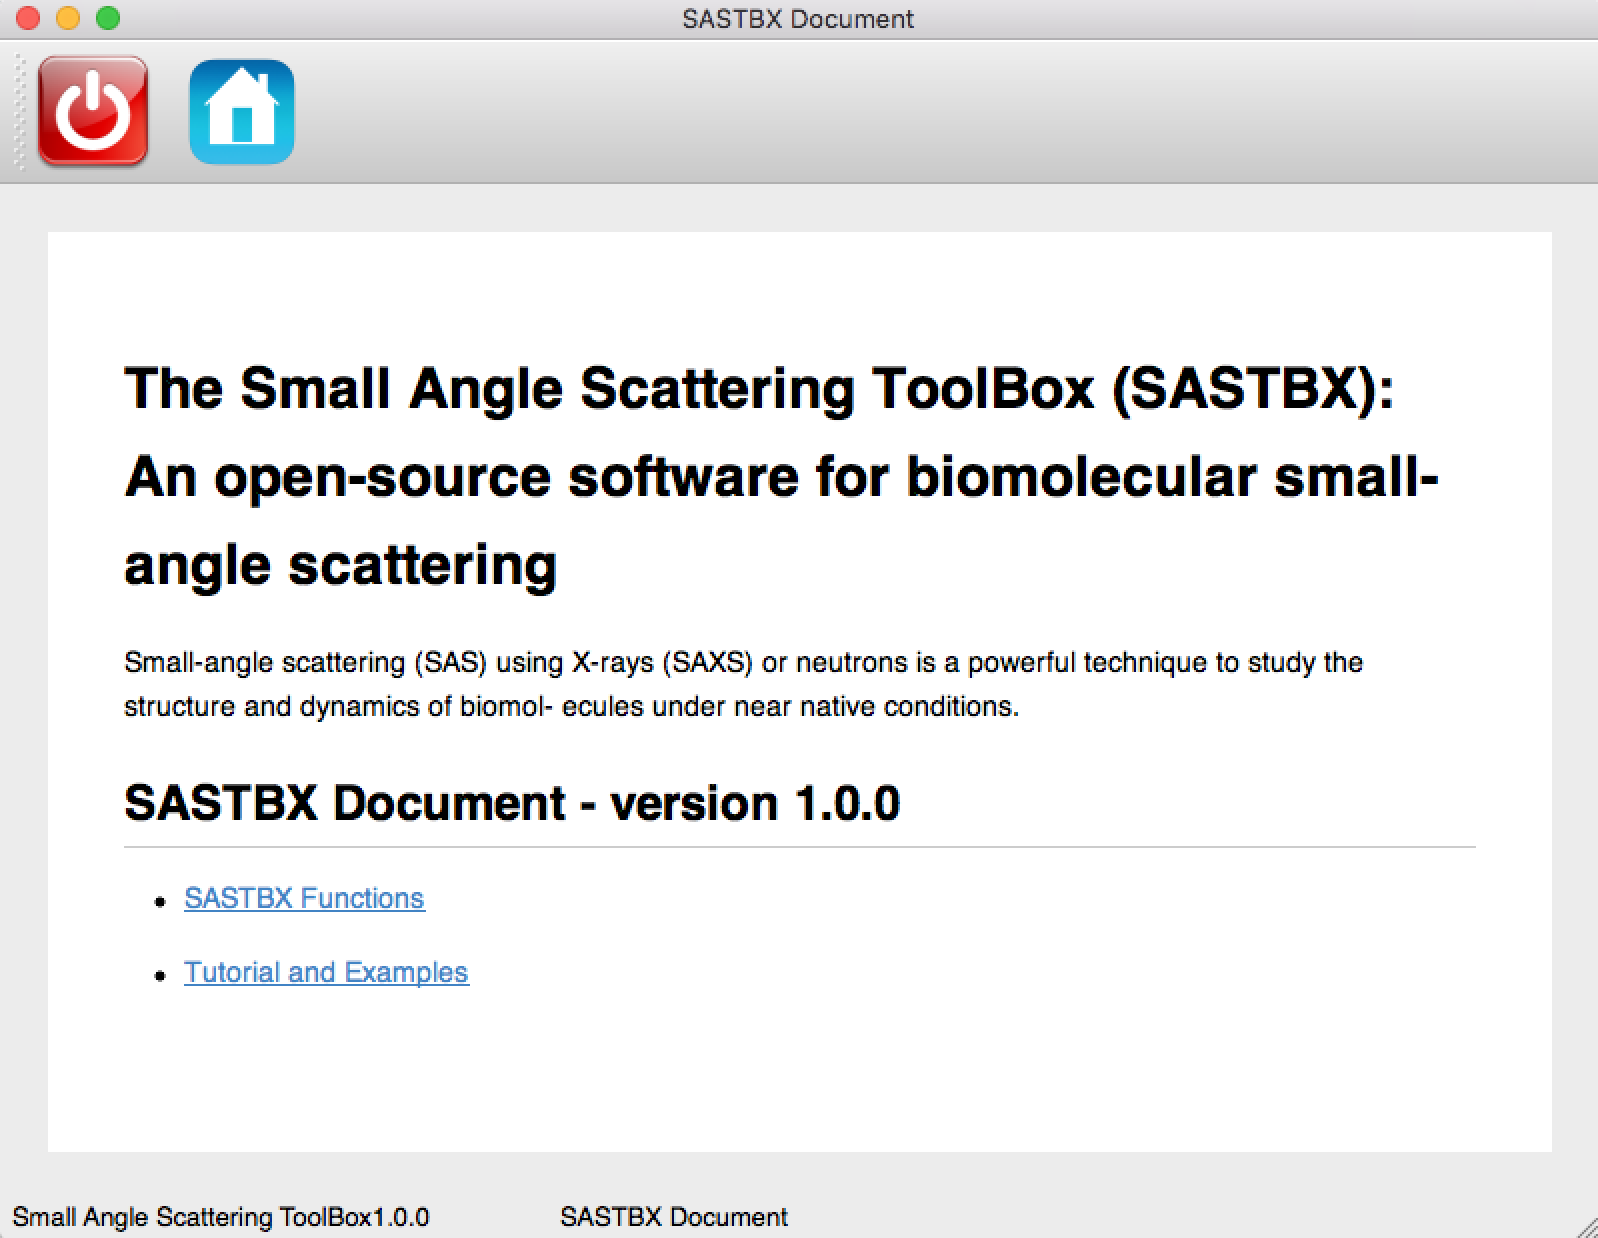
The SASTBX Functions link:
shows the principle of each function.
The Tutorial and Examples link: